
How to Connect AI to Your Amazon Data: Five Approaches Compared
If you manage an Amazon vendor business, you've probably already tried asking AI a question about your data. Maybe you downloaded a sales report from Vendor Central, uploaded it to ChatGPT or Claude, and typed "what were my best-selling ASINs last quarter?"
It works. Sort of. For that one file, for that one question, in that one session.
But then you want to cross-reference traffic data. Or compare to last year. Or look at the full catalog instead of a filtered slice. And suddenly you're spending more time prepping spreadsheets than analyzing results.
This article compares five approaches to connecting AI to Amazon Vendor Central data. We'll be specific about what works, what doesn't, and what it costs. Our goal is to help you make a good decision for your team, whether that's a $0 quick start or a six-figure platform investment.
A note on perspective: our company Reason Automation is a data infrastructure provider for Amazon vendors and sellers, and we offer solutions in two of these five categories: managed database access via MCP and data delivery via Snowflake Secure Data Share. We're an official Snowflake partner. I'll be straightforward about where our services fit and where other approaches are the better choice.
Contents:
The Five Approaches
All cost estimates assume a 5-person team (sales director, two category managers, finance lead, supply chain manager), each asking 3–5 analytical questions per day, 20 working days per month. The dataset is ~400 MB — a mid-size vendor's quarterly data across sales, traffic, inventory, forecasts, POs, and catalog.
| Dimension | A: File Upload | B: Code Execution | C: API via MCP | D: Enterprise Platform | E: Managed DB + MCP |
|---|---|---|---|---|---|
| Data capacity | Context window (~200K tokens) | Upload limits (~50 MB/file) | API rate limits (1–5 req/sec) | Unlimited (warehouse) | Unlimited (database) |
| Max data per query | ~600 KB | ~50 MB | ~50–200 KB/min throughput | Unlimited | Unlimited |
| Token efficiency | Raw data consumes full context | Data processed outside context | API results enter context | Result only (~500–2K tokens) | Result only (~500–2K tokens) |
| Computation accuracy | Approximated via text prediction | Exact (Python/pandas) | Depends on LLM processing | Exact (SQL engine) | Exact (SQL engine) |
| Cross-report joins | Only if both reports fit in context | Manual; AI guesses join keys | Not supported; APIs are independent | Configured in semantic layer | Pre-modeled in database |
| Data modeling | None | None | None | Full control (you build it) | Built and maintained for you |
| Semantic context | None | None | API field names only | You configure | ~4K field data dictionary |
| Historical depth | Whatever you downloaded | Whatever you uploaded | Limited by API availability | Whatever your pipeline loads | Full history, continuously updated |
| Real-time actions | No | No | Yes | No | No |
| Performance tuning | N/A | N/A | N/A (API-bound) | Full control | Managed |
| Setup time | Minutes | Minutes | Hours to days | Weeks to months | Hours |
| Ongoing maintenance | Re-upload each session | Re-upload each session | API changes, auth management | Pipeline, warehouse, semantic layer | None for end user |
| Infrastructure cost | LLM subscription only | LLM subscription only | LLM subscription + dev time | Warehouse + AI + compute | Database subscription |
| Non-Amazon data | Upload anything that fits | Upload anything that fits | Other APIs possible | Unify all sources | Amazon data only |
| Est. monthly cost | $100 + labor | $100 + labor | $100 + dev labor | $3,600–8,750 | $100 + data plan |
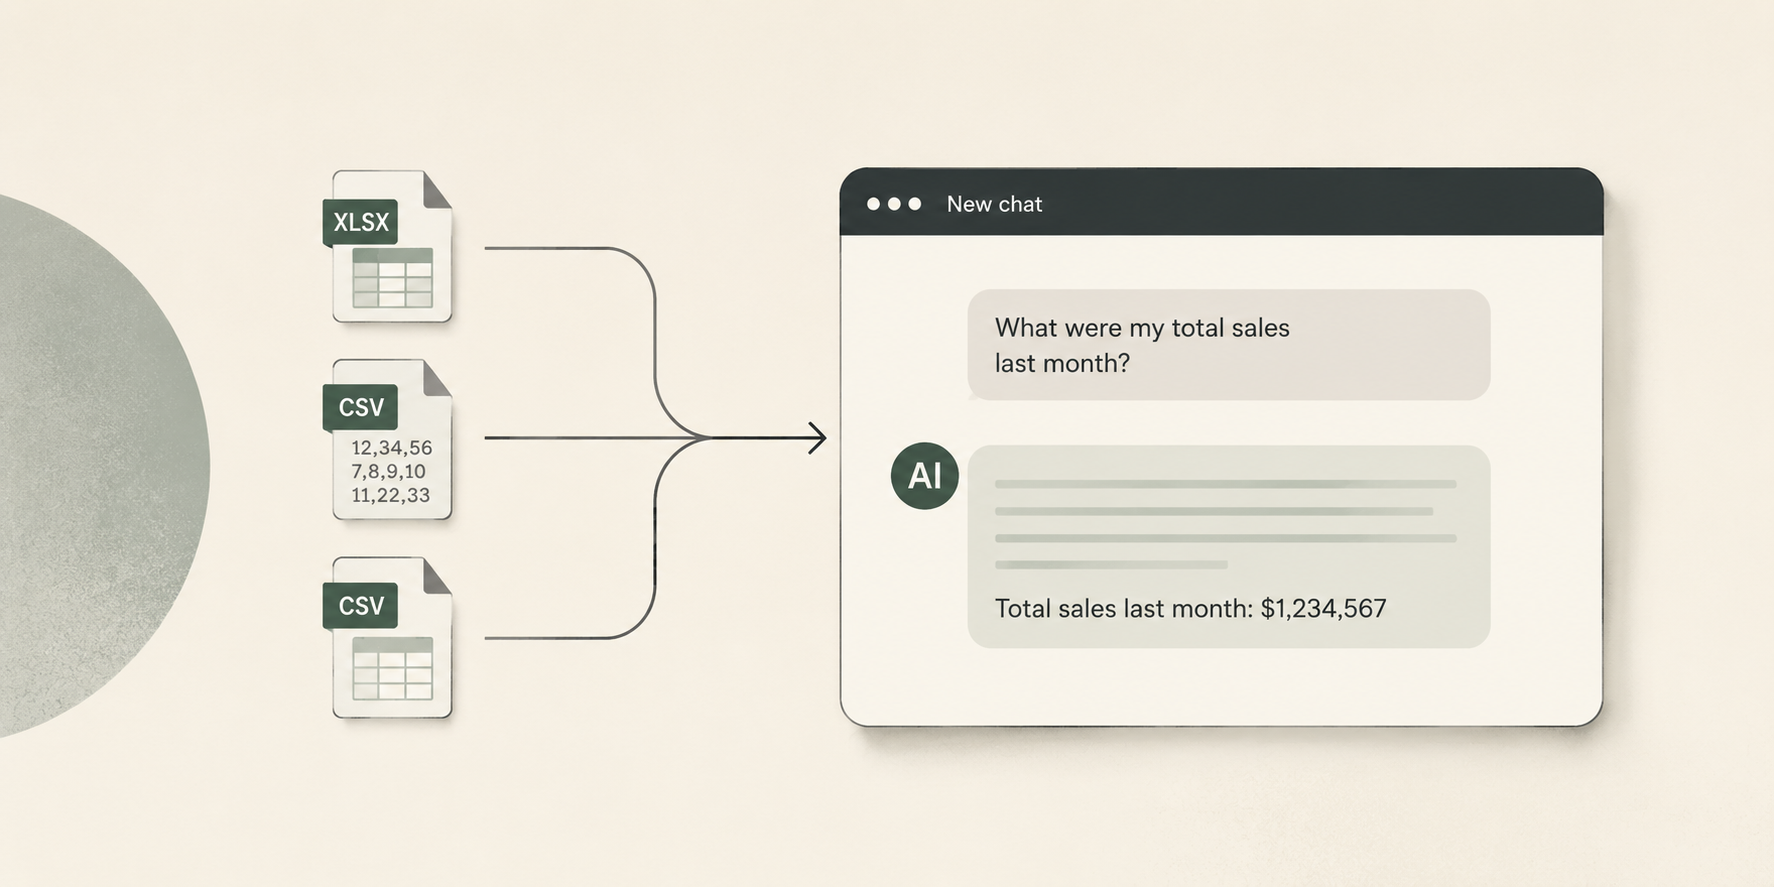
A: Upload Files Directly to an LLM
Download reports from Vendor Central as Excel or CSV files, upload them into Claude, ChatGPT, or similar. The AI reads the data as text in its context window.
This is what most people try first, and for good reason: it's free (beyond the LLM subscription), it's fast to set up, and it works for simple questions about small datasets.
The problems show up quickly at any real scale. You have to pre-filter every report manually — deleting columns, trimming date ranges, saving a smaller version — before the AI can even read it. The most valuable questions ("How does my traffic trend relate to my PO forecast accuracy?") require data from multiple reports, and if they don't fit in the context window together, the AI can't answer. Every conversation starts from scratch.
There's also a subtle accuracy problem: when the AI reads raw CSV data as text and tries to aggregate numbers, it's doing math through language prediction. It makes mistakes — skipped rows, rounding errors, miscounts — and these errors are silent.
| Line item | Cost |
|---|---|
| 5x Claude Pro or ChatGPT Plus subscriptions @ $20/mo | $100/mo |
| Data prep labor: ~30 min/day per person downloading, filtering, and re-uploading reports | 50+ hours/mo of team time |
| Total direct cost | $100/mo + significant labor |
| Max data per query | ~600 KB of CSV |
Best for quick, one-off questions about a single small report where you don't need historical depth or cross-report analysis.
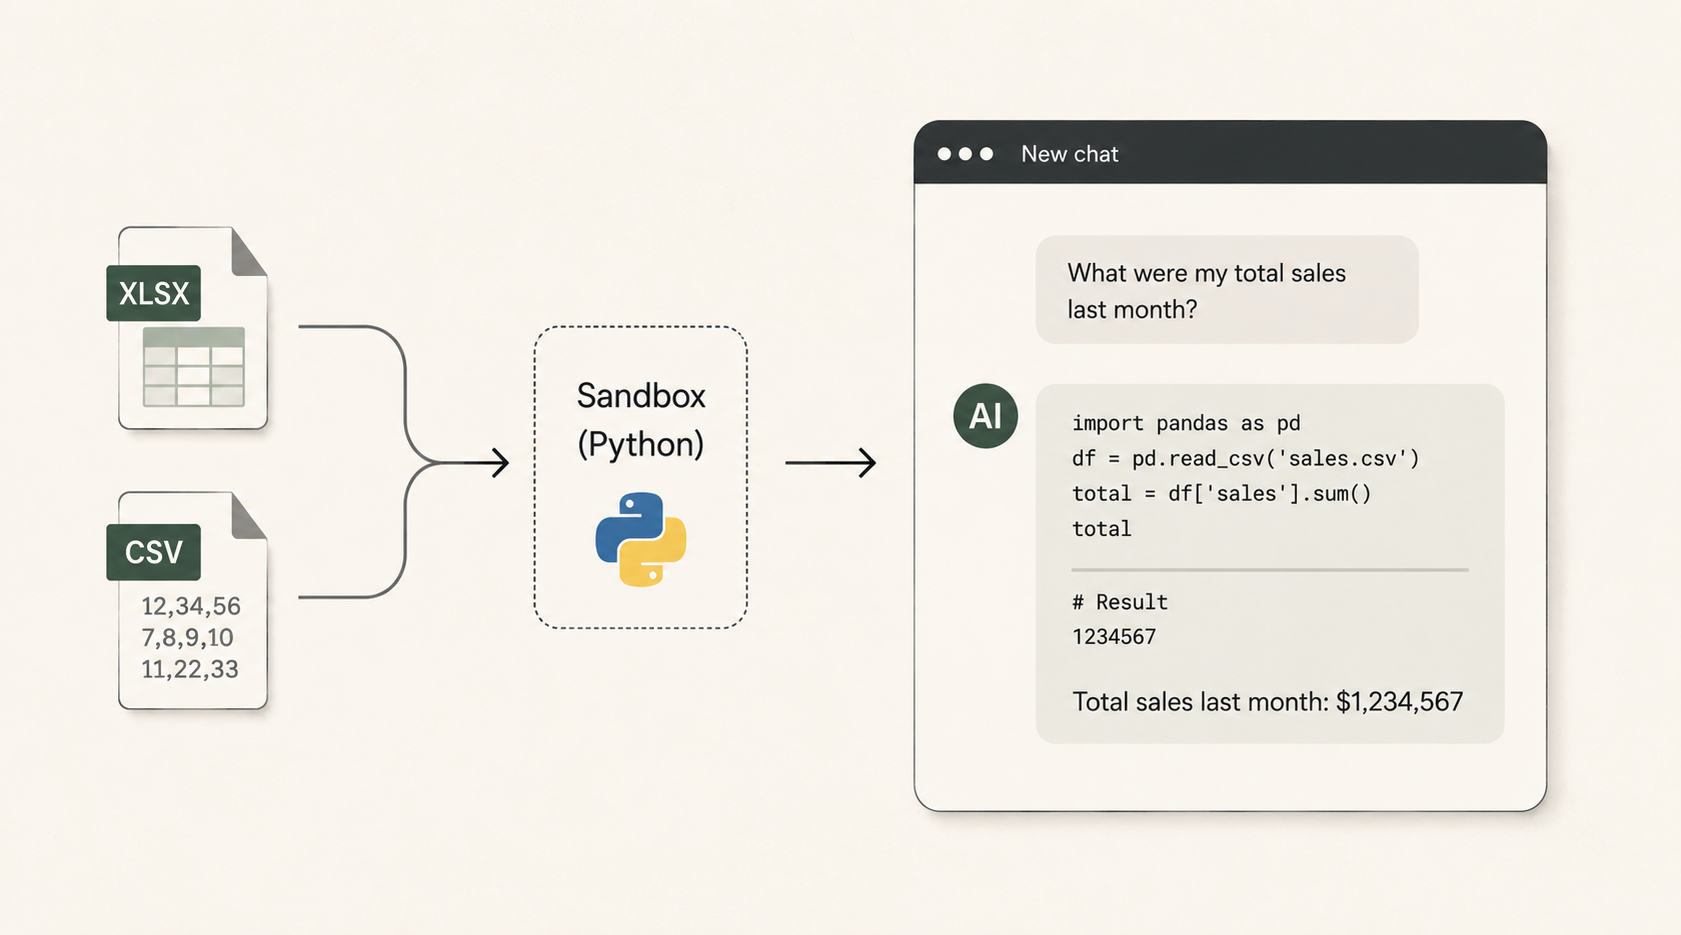
B: Upload Files to an LLM with Code Execution
Same file upload workflow, but using a feature like ChatGPT's Advanced Data Analysis (formerly Code Interpreter) or Claude's analysis tool. Instead of reading CSV data as text, the AI writes Python code (using pandas, numpy, etc.) and executes it in a sandboxed environment. The computation is deterministic: df['revenue'].sum() returns the exact answer.
This is a meaningful upgrade in accuracy. The AI isn't approximating aggregations through text prediction anymore — it's writing real code against real data. For a single report that fits within upload limits, this works well.
What still breaks at scale: ChatGPT caps CSV/Excel uploads at ~50 MB in practice. Sessions expire after 30 minutes of inactivity or 24 hours of continuous use — when that happens, uploaded files disappear and all variables reset. There's no persistent data layer, so each session starts fresh. Year-over-year trend analysis requires manually assembling and uploading all the relevant files each time.
Cross-report joins are particularly painful. You can upload multiple files, but the AI has to guess at join keys and field mappings. With raw Amazon reports, column names are inconsistent across report types and date formats vary. Derived metrics (Net PPM, conversion rate, contributed margin) have to be recalculated from scratch in every session.
| Line item | Cost |
|---|---|
| 5x ChatGPT Plus or Claude Pro @ $20/mo | $100/mo |
| Data prep labor: ~20 min/day per person (reduced but not eliminated) | 33+ hours/mo of team time |
| Total direct cost | $100/mo + moderate labor |
| Max data per query | ~50 MB per file |
Best for analysts who are comfortable with data prep and need accurate computation on single-report questions.
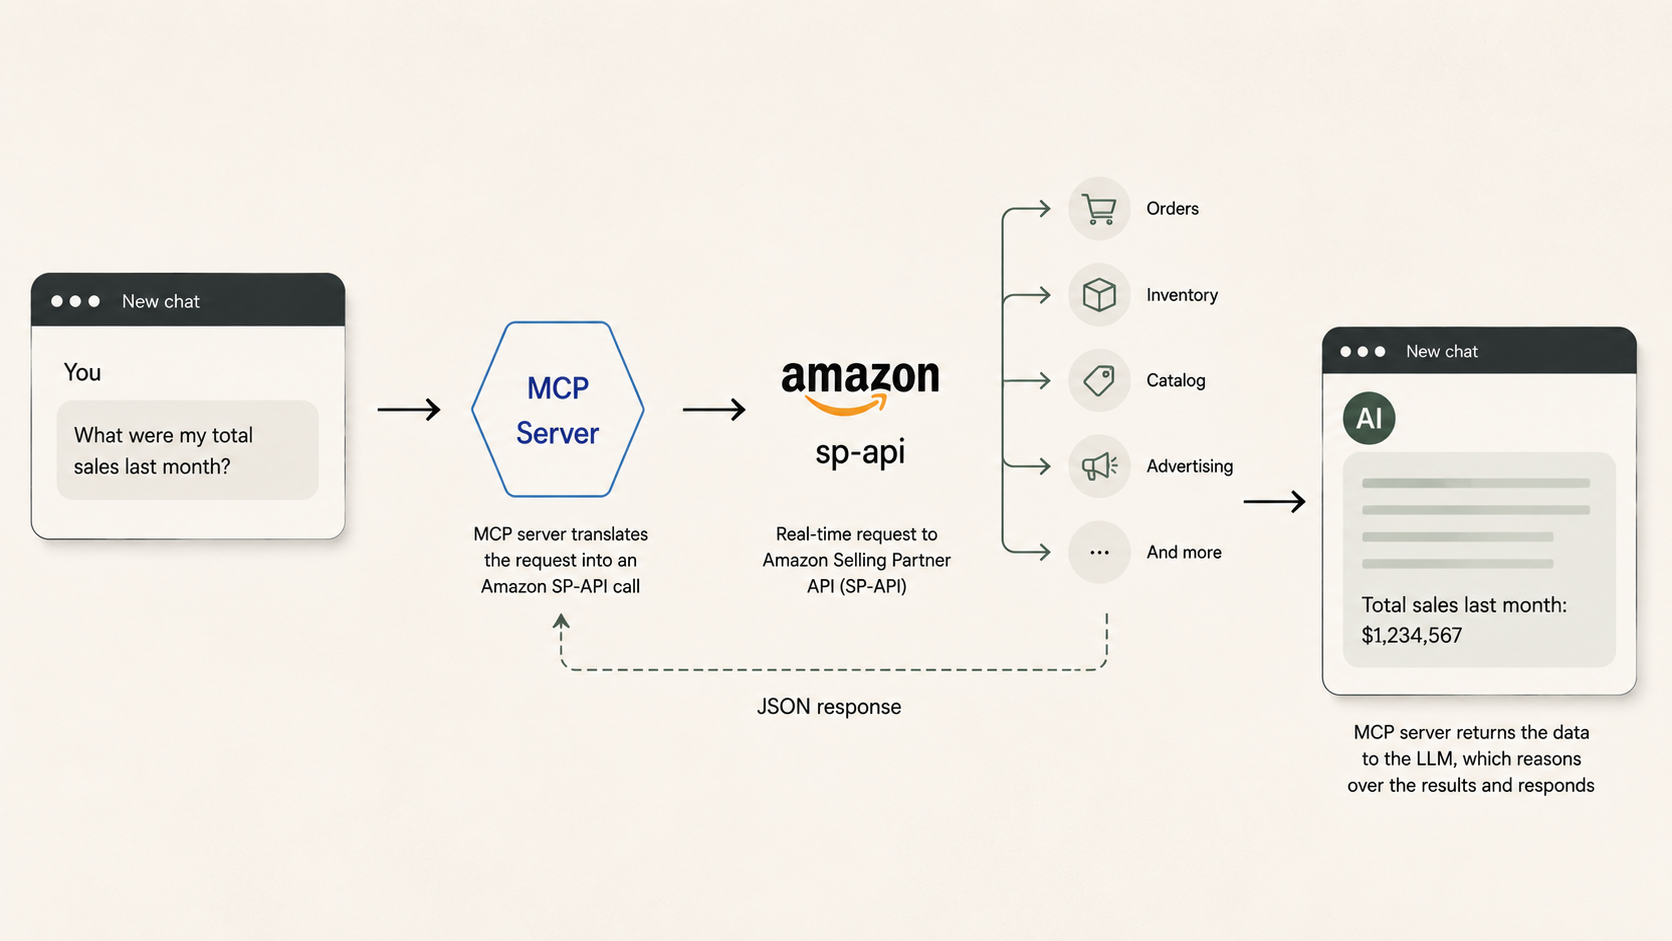
C: Connect an LLM Directly to the Amazon API via MCP
A growing category of tools wraps the Amazon Selling Partner API (SP-API), Amazon Ads API, or both in an MCP server that an LLM can call directly. Amazon launched an official Ads MCP server in open beta in February 2026. Third-party options include community-built SP-API wrappers on GitHub and hosted connectors from companies like Porter Metrics, Adzviser, and CData.
The idea is appealing: connect an LLM directly to the Amazon APIs, and it pulls live data on demand. No file downloads, no warehouse, no intermediate database.
For certain operational tasks, this works well. Creating or adjusting an ad campaign, checking current inventory levels for a handful of ASINs, or looking up a specific order are all well-suited to live API calls. The data is real-time, the LLM can take action (not just read), and the setup is straightforward for teams with API credentials and technical comfort.
Where it breaks down is analytics at scale. Amazon's SP-API is rate-limited: most endpoints allow 1–5 requests per second, with burst limits that deplete quickly. A question like "What were my top 10 ASINs by revenue last quarter?" might require pulling daily sales data across hundreds of ASINs over 90 days — thousands of individual API calls, throttled at a pace that could take minutes or hours, with any call potentially returning a 429 (Too Many Requests) error requiring retry logic.
Beyond rate limits: the API provides access to recent data, not a full historical archive. There's no pre-computed metrics or data modeling — derived metrics like Net PPM have to be computed on the fly every time. Every query pays a latency and reliability tax that a database query doesn't. And the setup requires AWS access keys, LWA credentials, refresh tokens, seller/vendor IDs, and marketplace IDs — developer-level configuration.
| Line item | Cost |
|---|---|
| 5x Claude Pro or ChatGPT Plus subscriptions @ $20/mo | $100/mo |
| SP-API developer application (registration, credentials) | $0 (free but requires technical setup) |
| Developer time to configure and maintain MCP server, handle auth, manage API changes | 10–20+ hours/mo |
| Total direct cost | $100/mo + ongoing dev labor |
| Max data per query | Rate-limited; ~50–200 KB/min throughput |
Best for technical teams that want real-time operational access (inventory checks, order lookups, ad campaign management) alongside analytics. The API is the right source for actions. Pair it with Approach D or E when you also need historical analysis at scale.
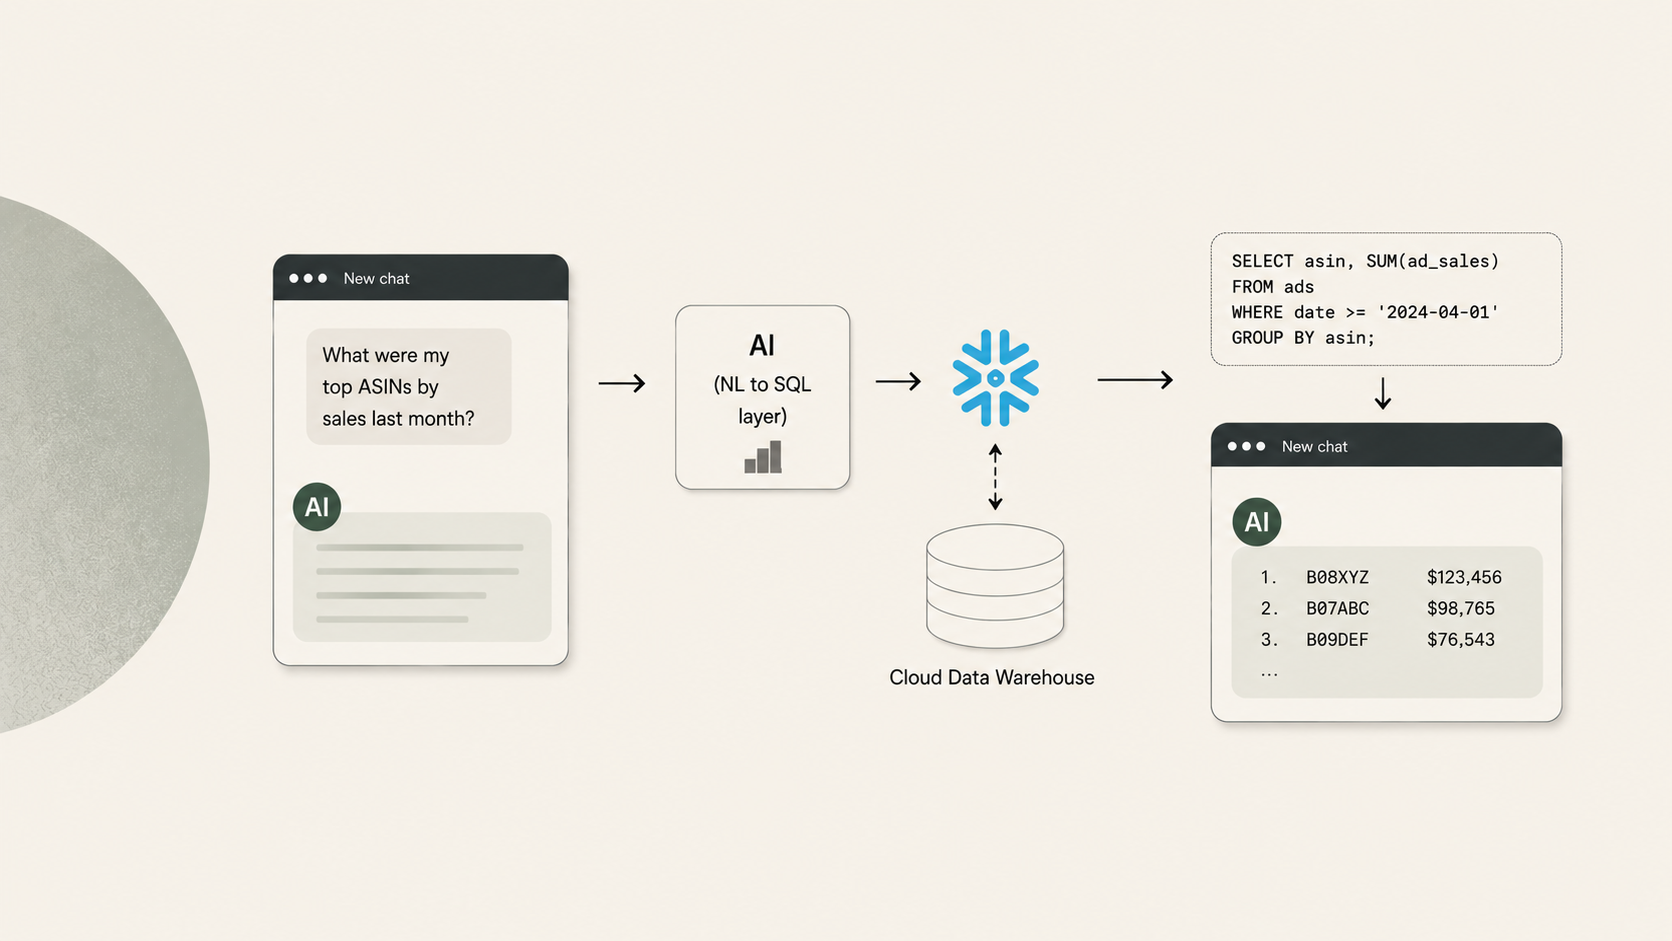
D: Enterprise AI Data & Analytics Platform
Snowflake Cortex Analyst, Databricks Genie, and Amazon QuickSight Q all follow a similar pattern: your data lives in a cloud data warehouse, and a built-in AI layer translates natural language questions into SQL queries executed by the warehouse engine.
This is the gold standard for organizations that can invest in it. The full dataset lives in the warehouse. SQL queries are deterministic and exact. There are no file upload limits, no session timeouts, no lost work.
Beyond basic querying, these platforms give you full control. You decide how data is modeled, staged, and cached. You control warehouse sizing and can scale compute independently of storage. You configure the semantic layer — Snowflake's YAML-based semantic models, Databricks' Unity Catalog and Genie Spaces, QuickSight's Q Topics — to map business language to the right tables and columns. For organizations with diverse data sources beyond Amazon (ERP, marketing, finance), an enterprise warehouse becomes the single source of truth.
Performance at scale is another strength. Snowflake's multi-cluster warehouses handle hundreds of concurrent users. Databricks can blend SQL queries with machine learning workloads. These platforms grow with your data ambitions well beyond Amazon analytics.
What they require: significant infrastructure investment. You need a warehouse account, data pipelines (ETL/ELT) to ingest your Amazon data, analytical table modeling, and semantic layer configuration. Someone on your team (or a consulting partner) needs to maintain all of it — pipelines, semantic models, warehouse sizing, cost governance — and keep it current when Amazon changes report formats. Setup takes weeks to months.
For organizations that have already made this investment for broader data strategy reasons, the marginal cost of adding Amazon analytics is much lower, and the payoff is significant. At scale, this approach is unmatched.
| Line item | Est. monthly cost |
|---|---|
| Snowflake Enterprise warehouse (X-Small, ~8 hrs/day, 22 days) | $1,050–1,600 |
| Snowflake storage (400 MB–1 GB compressed) | $25–50 |
| Cortex Analyst AI credits (~500 queries/mo) | $65–100 |
| Data pipeline tooling (Fivetran, dbt, or custom ETL) | $500–2,000 |
| Data engineering labor (contract or fractional hire) | $2,000–5,000+ |
| Total estimated cost | $3,600–8,750/mo |
| Max data per query | Unlimited |
Best for organizations investing in enterprise data infrastructure, with data engineering teams, diverse data sources to unify, and a need for full control over performance and cost governance.
E: Connect an LLM to a Managed, Purpose-Built Database via MCP
For organizations that aren't ready for (or don't need) an enterprise data warehouse, a managed approach delivers the same analytical architecture without the infrastructure buildout.
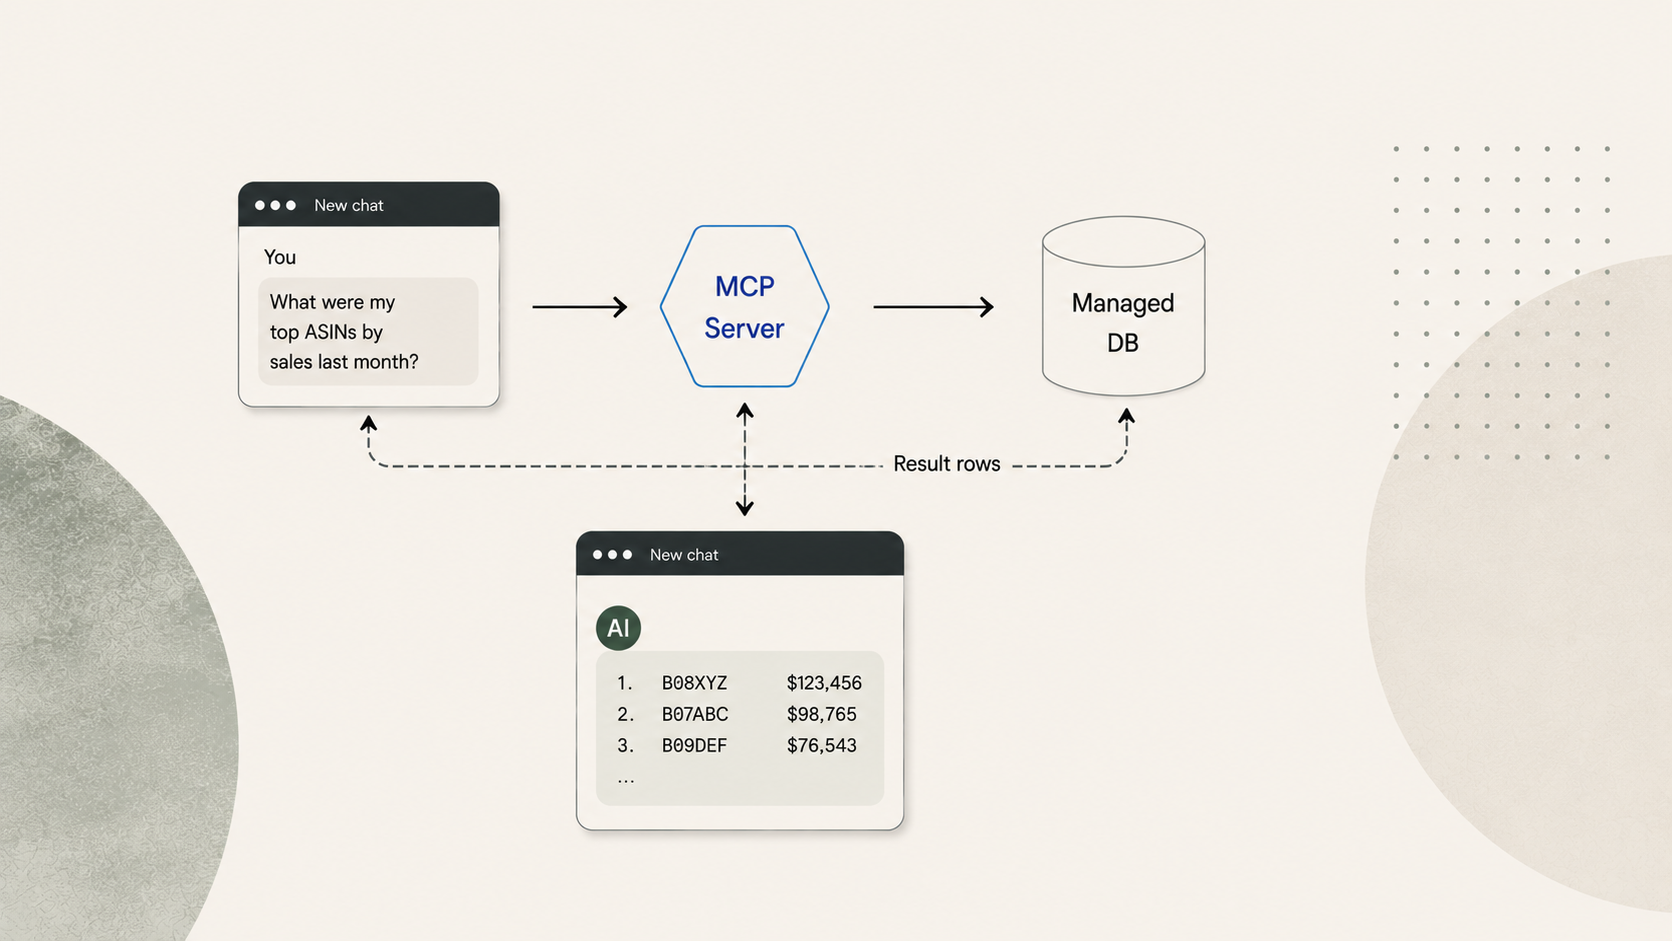
This is the model offered by specialized data providers like Reason Automation. Your Amazon data is modeled in a relational database maintained by domain experts. You connect an LLM (Claude, in this case) to that database through MCP. The LLM writes SQL queries, sends them to the database, and gets back result sets.
You ask a question in plain language. The LLM inspects the database schema and a data dictionary (Reason's contains ~4,000 field definitions specific to Amazon Vendor Central data), writes a SQL query, and sends it via MCP. The database executes the query against your full dataset and returns the result — maybe 30 rows of aggregated data consuming 500–1,000 tokens. The remaining 99% of the context window is available for the LLM to reason, explain, and follow up.
The database isn't a dump of raw Vendor Central files. It's a modeled analytical layer: consistent column names, normalized date formats, pre-calculated derived metrics. The data dictionary gives the LLM descriptions of what each field means in context, dramatically improving query accuracy. Data is refreshed on a schedule so you're always querying current information.
For organizations already on Snowflake, managed data providers can also serve as a complement to a full enterprise platform. Reason Automation is an official Snowflake partner and delivers Amazon data via Snowflake Secure Data Share, so enterprise clients can receive the same modeled data directly in their warehouse — taking advantage of existing Cortex AI investments and cross-platform joins — while the data modeling and pipeline maintenance remain managed. For teams starting without enterprise infrastructure, the MCP approach gets them productive immediately, and the path to Snowflake is there when they're ready.
| Line item | Cost |
|---|---|
| 5x Claude Pro subscriptions @ $20/mo | $100/mo |
| Reason Automation data subscription | Varies by plan |
| Data engineering labor | $0 (included) |
| Pipeline maintenance | $0 (included) |
| Semantic layer / data dictionary | $0 (included) |
| Total estimated cost | $100/mo + data subscription |
| Max data per query | Unlimited |
Best for teams that want turnkey Amazon analytics: full-dataset access, exact SQL computation, no infrastructure to manage. Especially well suited for small-to-mid-size vendor teams, or larger organizations that haven't yet begun the enterprise data platform journey.
Choosing the Right Approach
Choose C (API via MCP) if you have in-house developers comfortable with the SP-API, your primary use case is real-time operational access (inventory checks, order lookups, ad campaign management), or you're building custom tooling that needs to both read and write to Amazon. Pair it with D or E for historical analytics.
Choose D (enterprise platform) if you have or are building a data engineering team, you need to unify Amazon data with other enterprise data sources, you want full control over performance and cost governance, or you're already running Snowflake or Databricks. The investment is significant but the long-term payoff in flexibility and control is real.
Choose E (managed database + MCP) if you want to start querying your Amazon data this week rather than next quarter, you don't have (or don't want to build) a data engineering function, your primary need is Amazon analytics rather than cross-platform data unification, or you're a team where a $40K+ annual infrastructure investment isn't justified today.
Start with E, grow into D. Many organizations begin with a managed data subscription for immediate value, then add Snowflake or Databricks as their broader data strategy matures. Providers like Reason Automation support both paths: MCP-connected databases for turnkey access and Snowflake Secure Data Share for enterprise clients. The two aren't mutually exclusive — they're stages of the same journey.
The underlying principle is the same across C, D, and E: keep the LLM focused on reasoning, not data processing. Whether you're calling an API, querying a warehouse, or querying a managed database, the architecture that works is one where computation happens outside the LLM and only the results come back in. That's what separates useful AI analytics from the limitations of uploading spreadsheets.
Evaluation Criteria Explained
Data Capacity
Data capacity is the hard ceiling on how much source data each approach can work with.
For Approaches A and B, the limit comes from the LLM's context window or its file upload constraints. Every LLM has a context window — the total amount of text it can hold in memory during a single conversation. Think of it as the AI's working desk. Everything competes for space on that desk: your question, the system instructions, and whatever data you've loaded. Context windows are measured in tokens (roughly ¾ of a word, or ~4 characters of structured data).
| Model | Context Window | Approx. Usable for Data |
|---|---|---|
| Claude (Anthropic) | 200K tokens | ~150K tokens after system prompt |
| GPT-4o (OpenAI) | 128K tokens | ~100K tokens after system prompt |
| Gemini 1.5 Pro (Google) | 1M tokens | ~900K tokens after system prompt |
These numbers sound large. They are not large enough for serious analytics. A mid-size vendor's quarterly data easily reaches 400 MB. That tokenizes to roughly 100–130 million tokens — 500–650x the capacity of Claude's context window.
For Approach C, the limit is API throughput. There's no ceiling on what data exists behind the API, but rate limits constrain how fast you can retrieve it.
For Approaches D and E, the data lives in a database and there is no practical limit. The full dataset is queryable, and only the result enters the LLM's context.
Max Data per Query
This is the practical answer to: "How much of my data can the AI actually look at to answer a single question?"
Approach A (~600 KB): Claude's 200K-token context window leaves roughly 150K tokens usable after the system prompt. At ~4 characters per token, that's about 600 KB of raw CSV. In practice it's often less because structured data tokenizes inefficiently: column names, commas, line breaks, and repeated ASIN strings all consume tokens without adding analytical value. A single row of a typical Vendor Central sales report uses 40–80 tokens.
Approach B (~50 MB): The AI processes files via Python in a sandbox rather than loading them into the context window as text. This raises the ceiling roughly 80x compared to Approach A, but there's still a hard upload limit.
Approach C (~50–200 KB/min): This is a throughput number, not a capacity number. At 1–5 API requests per second, each returning a few KB of data, the practical retrieval rate is roughly 50–200 KB per minute. A single ASIN lookup is instant. A full-catalog aggregation over 90 days could require thousands of calls.
Approaches D and E (Unlimited): A SQL query against a database returns in milliseconds regardless of how much data it scans. The full 400 MB (or 4 GB, or 40 GB) is available for every query. Only the result — maybe 30 rows — enters the context window.
Token Efficiency
Token efficiency describes how much of the LLM's context window gets consumed by data overhead versus useful reasoning.
In Approach A, raw data floods the context. If you upload a 500 KB CSV, essentially all of it becomes tokens, and much of that is structural noise (repeated headers, delimiters, formatting). The AI has almost no room left to think.
In Approach B, the data stays in a sandbox file system rather than in the context window. The AI's context contains the code it wrote and the result, not the raw data. This is much more efficient, though the conversation can still fill up if you request many intermediate results.
In Approach C, the AI receives API responses in its context. A single lookup is small, but a multi-step analytical workflow can accumulate substantial API response data.
In Approaches D and E, a query against 400 MB of data might return 30 aggregated rows consuming 500–2,000 tokens. That's less than 1% of the context window. The remaining 99% is available for the AI to reason, explain, compare to benchmarks, and handle follow-up questions. This is the core architectural advantage of the database-backed approaches.
Computation Accuracy
This is whether the numbers you get back are exact or approximate.
In Approach A, the AI reads numbers as text and attempts to aggregate them through language prediction. Ask "what's my total revenue for Q1?" over a large dataset and it will make mistakes: skipped rows, rounding errors, miscounts. These errors are silent and very hard to catch.
In Approach B, the AI writes Python code — df['revenue'].sum() — and executes it. The computation is deterministic and exact, the same way a spreadsheet formula is exact.
In Approach C, accuracy depends on what happens with the API results. If the LLM aggregates raw API responses in its context (Approach A behavior), accuracy drops. If the API returns pre-aggregated data or the LLM writes code to process it, accuracy improves.
In Approaches D and E, a SQL engine computes the answer. SUM(ordered_revenue) returns the exact result every time, computed by a system designed for this purpose. This is the same level of accuracy as a database report or BI dashboard.
Cross-Report Joins
The most valuable analytical questions often span multiple data sources. "How does my traffic trend relate to my PO forecast accuracy?" requires joining traffic data with forecast data. "What's my Net PPM by ASIN after chargebacks?" requires joining revenue data with fee data.
In Approach A, both reports must fit in the context window simultaneously. With a ~600 KB limit, this is usually impossible for anything beyond trivially small datasets.
In Approach B, you can upload multiple files and the AI will write code to merge them. But it has no knowledge of the relationships between Vendor Central report types, so it's guessing at join keys and field mappings. Column names are inconsistent across report types and date formats vary.
In Approach C, each API endpoint is independent. The SP-API doesn't support cross-endpoint joins. The LLM would need to make separate API calls, hold both result sets in context, and join them itself.
In Approach D, cross-report joins are configured in the semantic layer. You define once how sales data relates to traffic data, and the AI generates the right SQL JOIN automatically.
In Approach E, the joins are pre-modeled in the database. The data provider has already defined how tables relate to each other, so the AI generates correct joins without any configuration from the end user.
Data Modeling
Raw Vendor Central data is not analysis-ready. Column names vary across report types ("Ordered Revenue" vs. "ordered_revenue" vs. "Rev"). Date formats differ. Some critical metrics don't exist in any single report and must be derived from multiple sources: Net PPM requires combining revenue, cost, and fee data; conversion rate requires dividing ordered units by glance views from a separate traffic report.
Data modeling is the process of transforming raw data into a clean, consistent, analysis-ready structure. In Approaches A, B, and C, there is no data model — you're working with raw data every time, and derived metrics have to be recalculated from scratch in every session.
In Approach D, you build and maintain the data model yourself (or hire someone to do it). You have full control over how tables are structured, what derived metrics exist, and how they're calculated. This is powerful but requires ongoing investment.
In Approach E, the data model is built and maintained by the data provider. For Amazon vendor data specifically, this means the provider has already solved the problem of inconsistent field names, date normalization, metric derivation, and cross-report relationships.
Semantic Context
Semantic context is the metadata that helps the AI understand what your data means, not just what it contains. A column named gv is meaningless to an AI without context. A data dictionary entry that says "gv: Glance Views — the number of times customers viewed the product detail page on Amazon.com, as reported in the Traffic Diagnostic report" tells the AI exactly what to do with it.
In Approaches A, B, and C, the AI sees column names and infers meaning. Sometimes it guesses right. Sometimes it doesn't.
In Approach D, you configure a semantic layer — Snowflake's YAML-based semantic models, Databricks' Genie Space instructions, QuickSight's Q Topics with synonyms. This is the mapping between business language ("revenue by ASIN") and the actual table/column references the SQL needs. Building and maintaining this layer is part of the ongoing cost.
In Approach E, the data provider maintains a curated data dictionary. Reason Automation's contains ~4,000 field definitions specific to the Amazon vendor ecosystem. The AI consults this dictionary when writing queries, which dramatically improves accuracy compared to raw schema interpretation.
Historical Depth
How far back can you look?
In Approaches A and B, you can only analyze data you've downloaded and uploaded. If you didn't save last year's Q3 traffic report, it's gone. Every analysis is limited to whatever files you happen to have on hand.
In Approach C, you can only access data the API currently exposes. Amazon's APIs provide access to relatively recent data, not a full historical archive. Long-term trend analysis and seasonality modeling may not be possible.
In Approach D, historical depth depends on what your pipeline loads. If you've been ingesting data for two years, you have two years of history. If you started last month, that's all you have.
In Approach E, the data provider maintains history from the date you become a customer. Data accumulates continuously and is available for any query going forward.
Real-Time Actions
This is the one dimension where Approach C stands alone. An LLM connected to the Amazon APIs via MCP can not only read data but also write to Amazon: creating ad campaigns, adjusting bids, updating inventory. This is operational automation, not analytics, but it's a genuine capability the other approaches don't offer.
Approaches A, B, D, and E are read-only. If you need both analytics and the ability to take action on Amazon, Approach C is the right complement to a database-backed approach (D or E) for the analytical side.
Performance Tuning
Performance tuning is the ability to control how fast queries execute, how data is cached, and how compute resources are allocated.
In Approaches A, B, and C, there's nothing to tune. You're bound by the LLM's context window, the sandbox's processing speed, or the API's rate limits.
In Approach D, you have full control. You size your Snowflake warehouse (X-Small through 6XL), configure result caching, define clustering keys for frequently queried columns, set up materialized views for expensive aggregations, and scale up during peak hours. This is powerful for organizations with demanding performance requirements or cost-optimization goals.
In Approach E, performance is managed by the data provider. You don't choose the server size or caching strategy. For most analytical workloads this is fine — queries return in seconds. But if you need sub-second response times on complex aggregations or support for hundreds of concurrent users, Approach D gives you the levers to get there.
Setup Time
How long from "we decided to do this" to "we asked our first real question."
Approaches A and B: minutes (but that's per session — every session starts over). Download a file, upload it, ask.
Approach C: hours to days. Register for SP-API access, set up OAuth credentials, configure the MCP server, test the connection. Requires developer involvement.
Approach D: weeks to months. Provision a warehouse, build data pipelines, model the data into analytical tables, configure the semantic layer, test and iterate.
Approach E: hours, one time. Connect the MCP server to your LLM, authenticate, and start querying. The database and data model already exist.
Ongoing Maintenance
What does it take to keep this running after initial setup?
Approaches A and B require re-downloading and re-uploading data every session. This isn't "maintenance" in the traditional sense, but it's a recurring cost in team time that never goes away.
Approach C requires monitoring and updating the MCP server as Amazon updates the SP-API: new endpoints, deprecated fields, changed rate limits, revised auth flows. Community-maintained open-source servers may lag behind these changes.
Approach D requires maintaining data pipelines, updating semantic models when Amazon changes report formats, monitoring warehouse costs, and managing warehouse sizing. This is the flip side of full control: you're responsible for everything.
Approach E requires nothing from the end user. The data provider maintains the pipeline, the data model, and the infrastructure.
Infrastructure Cost
The direct platform and tooling costs, separate from LLM subscriptions and labor.
Approaches A and B have no infrastructure cost. You pay for the LLM subscription ($20/mo per user) and nothing else.
Approach C has no platform cost, but developer time for setup and maintenance is a real expense. Budget 10–20+ hours per month if you're hiring a contractor to manage the integration.
Approach D has transparent, controllable costs: warehouse compute, storage, AI query credits, and pipeline tooling.
Snowflake charges ~$3/credit for Enterprise edition
An X-Small warehouse running 8 hours/day costs roughly $1,050–1,600/mo in compute
Cortex Analyst adds 6.7 credits per 100 requests
Pipeline tooling (Fivetran, dbt, etc.) adds $500–2,000/mo
And someone has to manage all of it
Approach E has a managed data subscription that covers the database, pipeline, and data model. The exact cost varies by provider and plan but is typically a fraction of Approach D's total because infrastructure and data engineering are amortized across the provider's customer base.
Non-Amazon Data
If your analytical needs extend beyond Amazon — joining Vendor Central data with Shopify sales, Google Ads spend, ERP data, or financial systems — the approaches differ significantly.
Approaches A and B let you upload anything that fits, from any source. The file format doesn't matter as long as it's tabular.
Approach C can theoretically connect to other APIs, but each one requires its own MCP server, credentials, and maintenance.
Approach D is purpose-built for this. An enterprise data warehouse is designed to unify diverse data sources. This is one of its core value propositions and a primary reason organizations invest in the platform.
Approach E is typically focused on a single domain (Amazon vendor data, in this case). It's not designed to be a general-purpose data warehouse.