Andrew Hamada
|
Amazon Demand Forecasting for Vendors
Guides & How-to
Amazon provides a consumer demand forecast for vendors in Retail Analytics. It’s the only leading indicator of what Amazon will buy from you, but most people dismiss it. Why?
It’s a consumer demand forecast. You care about Amazon’s purchase orders, but they only share a sell-through forecast for customer sales. Translating it into a PO forecast takes more work, data, and assumptions. Worse, there’s no guarantee that Amazon will fulfill the demand with product sourced from you, and not from a distributor or FBA.
It’s seemingly unreliable. Amazon’s purchase orders don’t seem to correlate with the Retail Analytics forecast, so what’s the point?
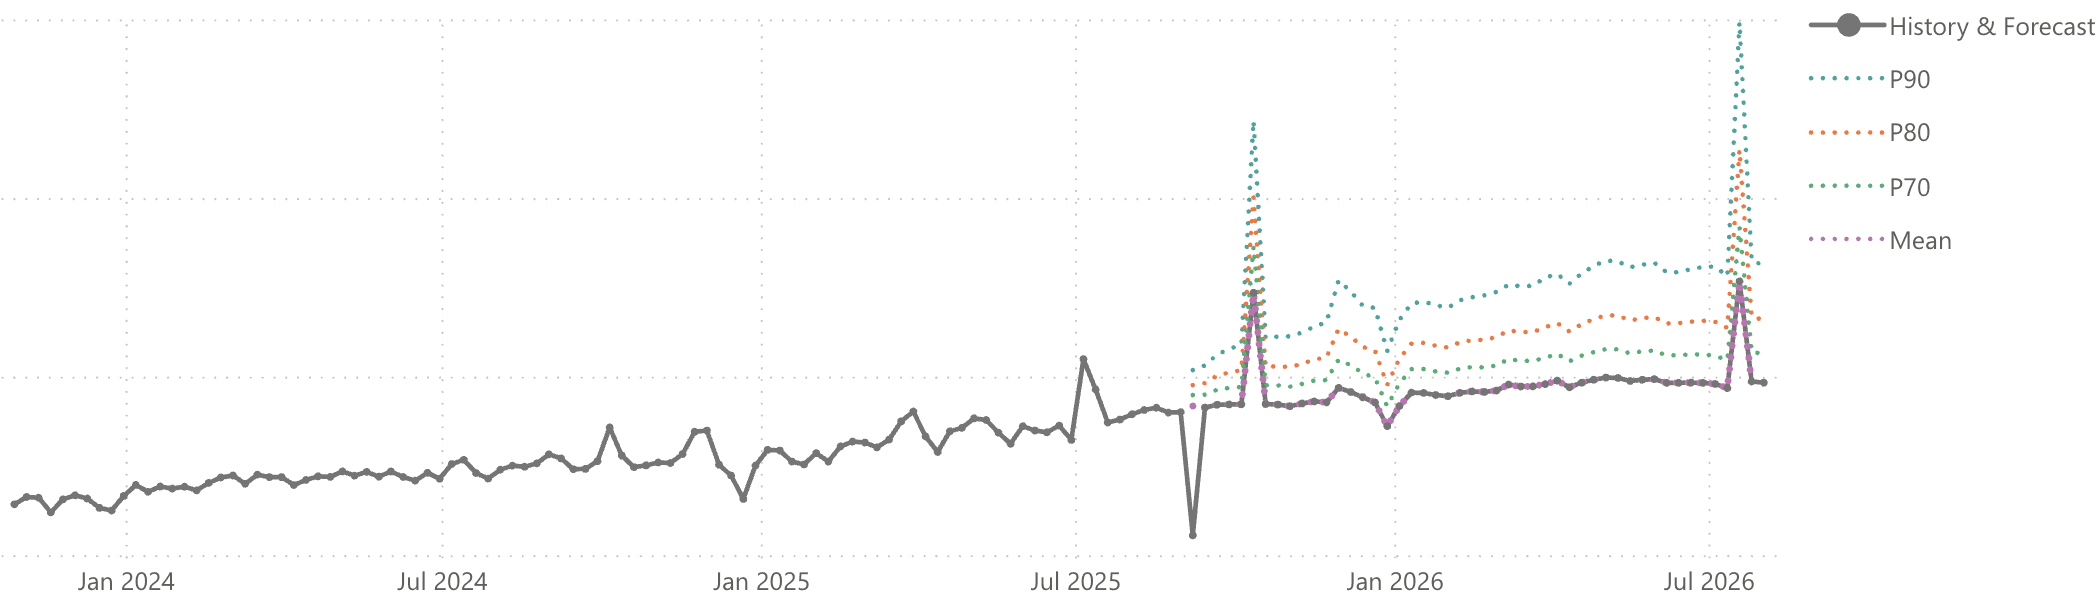
It’s confusing. There are four different forecasting models to choose from, but Amazon doesn’t do a good job of explaining them, and their names are unintuitive: “P90” sounds like the most likely forecast, but it’s actually the opposite.
It’s presented with no context. You need to see prior sales performance to measure the accuracy of Amazon’s forecasts, but Amazon presents them in isolation with no historical demand.
These challenges can feel insurmountable without help.
That’s why we built a forecast tool that helps you make sense of Amazon’s consumer demand planning. You’ll learn how to evaluate Amazon’s forecast accuracy by product and custom category, then apply those forecasts to PO predictions using weeks-of-cover calculations. All made easy with BASIS.
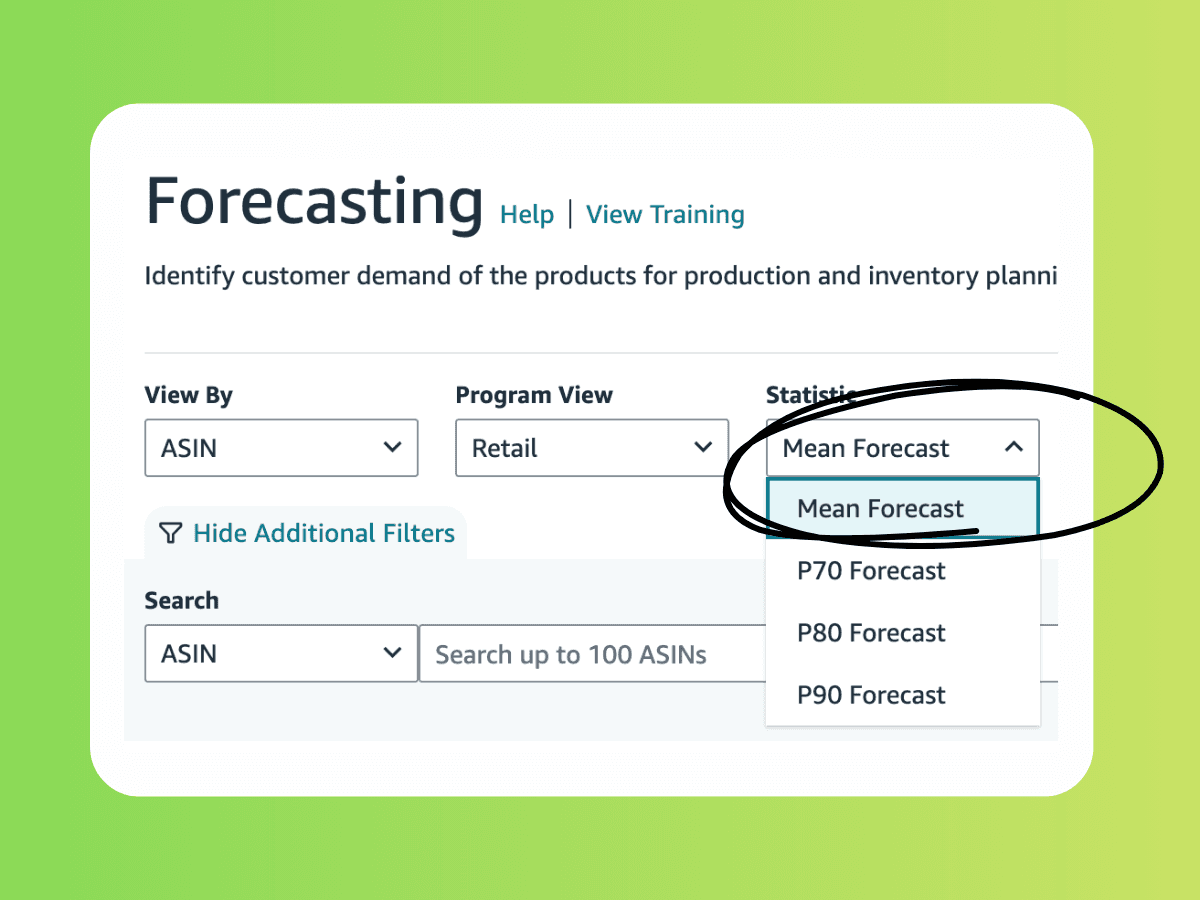
What are Amazon P70, P80, P90, and Mean forecasts?
Amazon provides four different statistical forecasting models for vendors to choose from. Each model has a different probability (P-level) of being true. The higher the P-level, the more likely that customer demand will be at that level or lower.
The words “or lower” are critical. Amazon is saying that the P90 forecast is the most optimistic, not the most likely.
How to interpret the four forecast statistical models:
Mean forecast: Amazon’s best estimate of average consumer demand. You can think of this as the “P50” forecast, where demand is equally likely to be higher or lower. Most brands treat this as the lower bound of what Amazon will stock for.
P70 forecast: 70% chance that customer demand will be at this level or lower.
P80 forecast: 80% chance that customer demand will be at this level or lower.
P90 forecast: 90% chance that customer demand will be at this level or lower. In other words, this is Amazon’s most optimistic forecast and the least likely to come true.
How Accurate are Amazon’s Forecasts?
Everyone wants to understand how reliable Amazon’s forecasts are. There is no generally-applicable answer because:
Amazon doesn’t share their forecast model, how it works, or when they make changes to the algorithms or inputs. This makes it difficult to completely trust, especially when investing in or allocating inventory.
It’s hard to predict external factors like natural disasters, tariff and tax changes, and consumer behavior changes or trends that can seriously impact demand.
Accuracy can vary by product, category, and geography. Not surprisingly, Amazon’s forecasts are usually more accurate for high-volume products in established categories and marketplaces. Their forecasts are worse for long-tail selection, new products, and newly-launched countries.
Each brand should make their own determination by comparing Amazon’s forecasted unit demand to their actual sales history. We recommend comparing forecasted year-over-year growth to your actual year-over-year growth.
The example below is from our BASIS dashboard. We compare Amazon’s forecasted year-over-year growth rate to your actual growth rates over the past 4, 12, 26, and 48 weeks. Giving you multiple periods helps you understand whether your growth has been accelerating or decelerating, and whether Amazon is predicting your growth trends will continue.
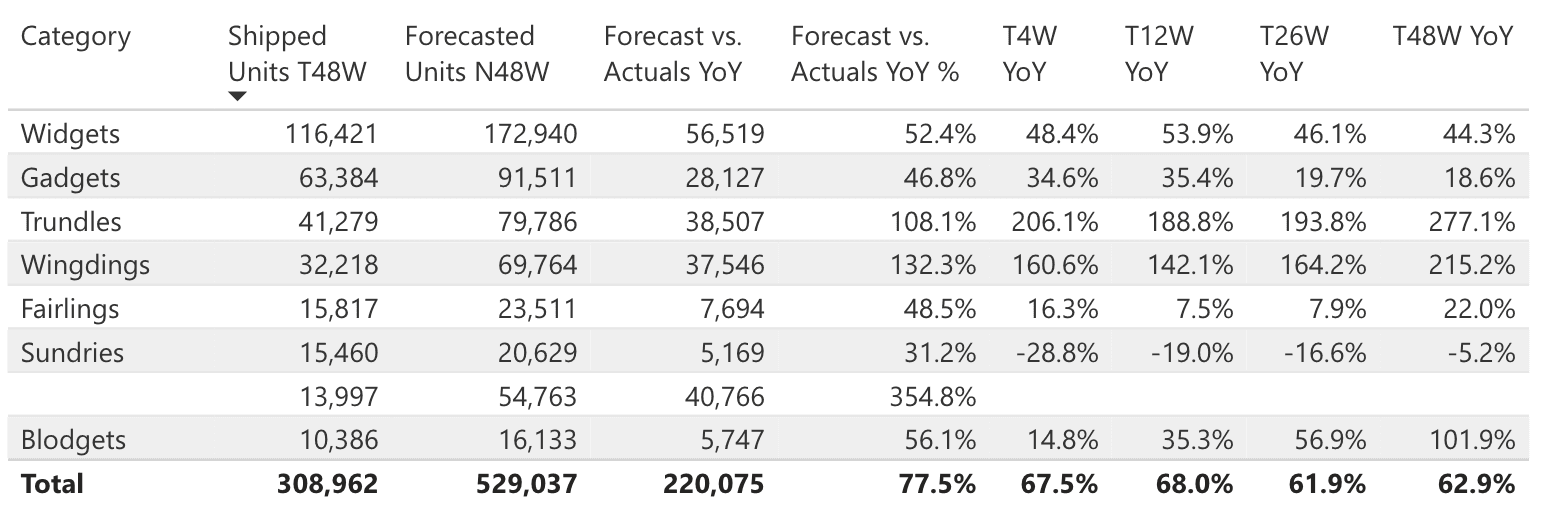
In this example, Amazon is forecasting 77.5% growth for this brand, compared to 67.5% most recently. This represents accelerating growth: from 62.9% (T48W) to 67.5% (T4W) to 77.5% (N48W).
But things get interesting when you break down Amazon’s forecast by product — or even better, by custom category or subcategory. Look at how different Amazon’s growth forecast differs by category in our example. Amazon forecasts only 108% growth for the Trundles category despite recent growth of over 200%. These differences are worth exploring and understanding.
Look for categories or product lines where Amazon’s forecast is consistently inaccurate. For example, if Amazon’s forecast for Trundles is consistently ~100% understated, then we can predict future demand by doubling the forecast.
Using forecast history to calculate average error rate by Model
Amazon updates their forecast every week, but they only share their current forecast in Vendor Central and the old ones are not available for download. This makes it impossible to track changes unless you store and model the data, like we do for our customers. What insights does this unlock?
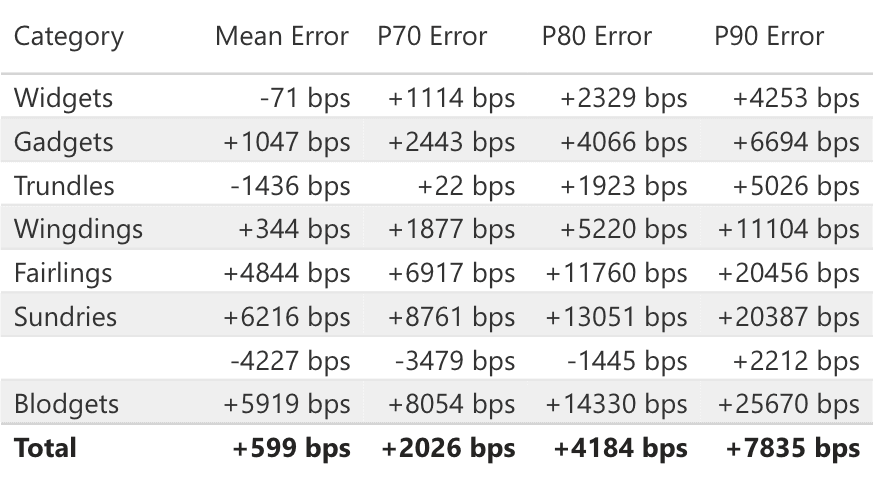
1. Calculate Amazon’s average forecast error by product, product line, or any grouping you define. This lets you judge precisely how close Amazon’s previous predictions were to your actual demand.
If you compare error rates by product and statistical model (e.g. P70 vs. P80), you can find “pockets of reliability” where Amazon’s forecast is reliable enough for demand planning.
In this example, the mean forecast is the most accurate model for Widgets (-71 bps error), but poor for Trundles (-1436 bps). Instead of broadly applying one forecast model, the brand can use the mean forecast for Widgets, and the P70 forecast for Trundles.
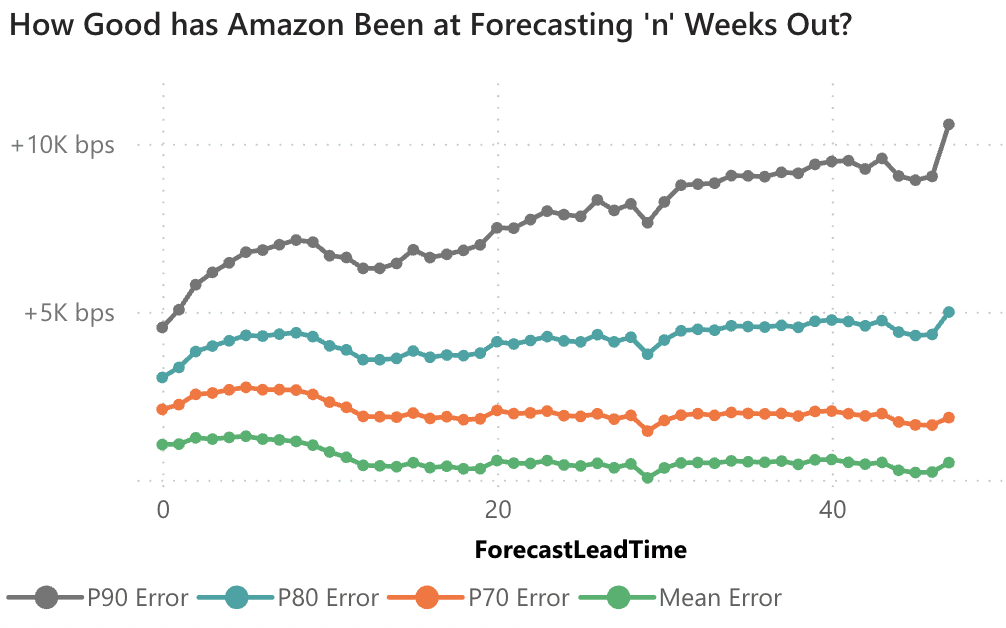
2. See Amazon’s forecast accuracy by week. How much more reliable are Amazon’s predictions for the next 4 weeks, than their predictions for the far future? By building a library of forecasts, you can see how Amazon’s forecast error varies by week over time.
This analysis can reveal weaknesses in the forecast for your products. In this example, Amazon’s prediction accuracy declines for 8-9 weeks before declining again.
How to Forecast Purchase Order Demand Using the Retail Analytics Forecast
Let me start by saying that there is no magic forecasting formula, and I would be much wealthier if I knew of one. But everyone wants the same thing—to predict Amazon’s purchase orders using any available means.
Amazon’s ordering levels are a function of (1) forecasted consumer demand, (2) weeks of cover strategy, and (3) profitability and/or strategic importance of your products. Brands are more successful translating consumer demand into PO predictions when they consider these factors together.
1. Calculate your anticipated your consumer demand. Start with Amazon’s forecasts and determine which models seem most applicable to your selection. Use tools like BASIS to easily explore forecasts by product, custom grouping, and statistical model.
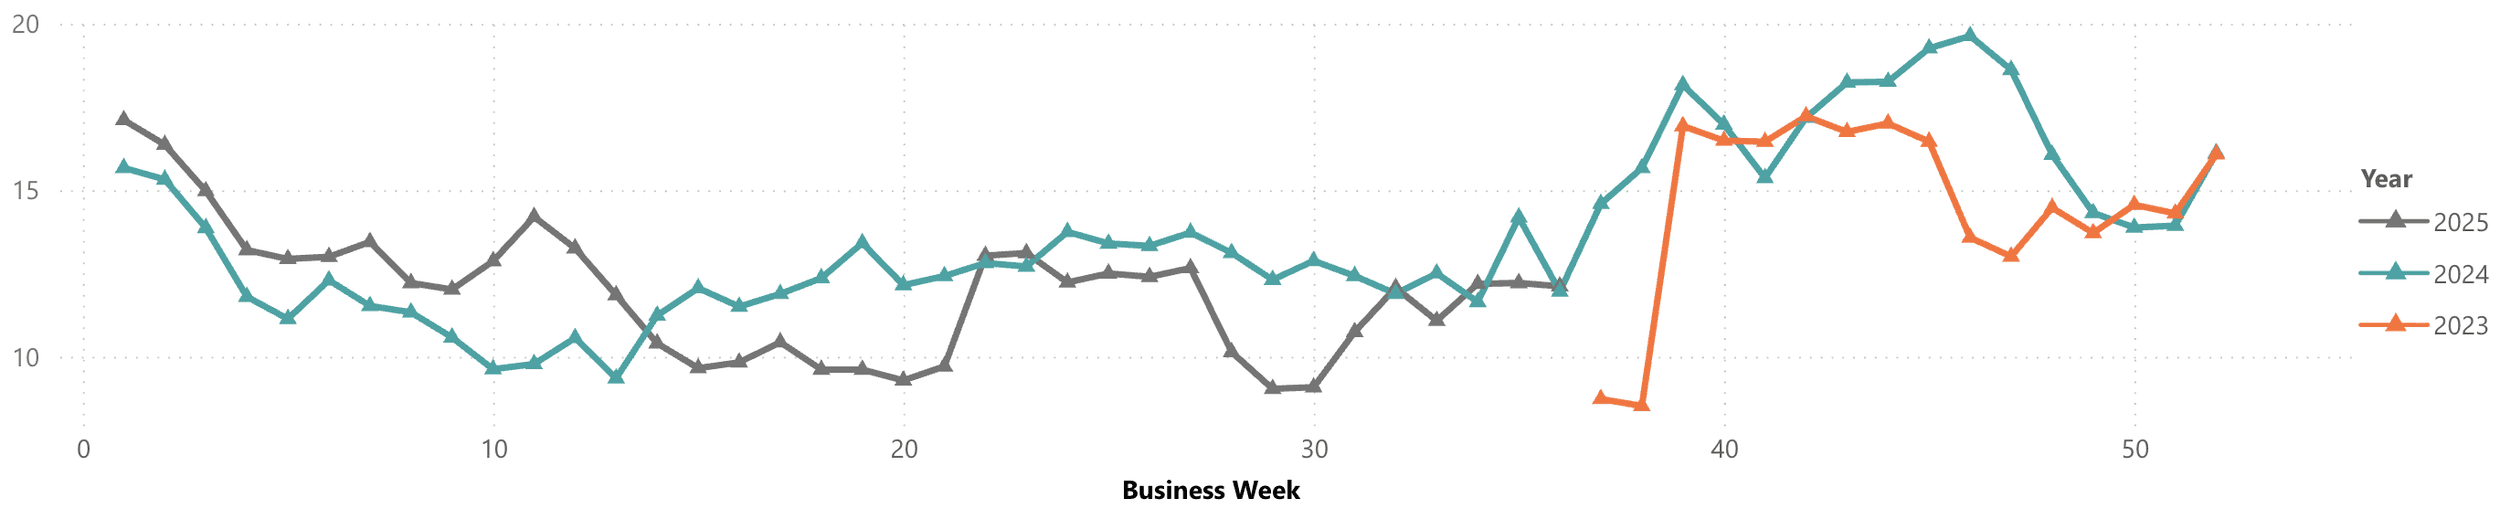
2. Track weeks of cover (WoC) for your products over time, looking for seasonal or other changes in average inventory levels. We use a simple formula, averaging 4 weeks of demand then dividing current sellable inventory. By visualizing WoC by week, with separate trend lines for each year, it’s easy to spot seasonal changes to Amazon’s stocking strategy—and you can spot deviations sooner.
If you have a high confirmation rate and consistent vendor lead time (VLT), you might consider including your open PO quantity as well.
3. Combine your adjusted demand forecast and weeks-of-cover forecast to calculate Amazon’s desired inventory levels by product. Work backwards including your VLT and current inventory levels to arrive at a rough PO forecast that will get more accurate as the date approaches.
4. Consider profitability and strategic factors that might impact Amazon’s ordering.
Track net PPM and operational profitability —> Amazon may order less if your products become less profitable.
Related: closely monitor price matches, average selling price (ASP), and buy box activity with tools like SmartScout.
Load any planned promotions into Vendor Central as early as possible and tell your vendor manager about plans that can impact traffic (e.g. external media), pricing (e.g. planned cost changes), or availability (e.g. allocation).
Be honest about the strategic importance of your selection to Amazon—especially for acquiring customers. If you are a leading consumer brand that people search for, Amazon will tolerate lower profitability and preserve more space in fulfillment centers.
Competitive activity like price promotions, new product launches, and major new advertising campaigns can throw off the most rigorous demand forecast.