Andrew Hamada
|
Measuring Lost Buy Box and lost featured offer % as a 1P vendor
Guides & How-to
[caption id="" align="alignnone" width="1474"]
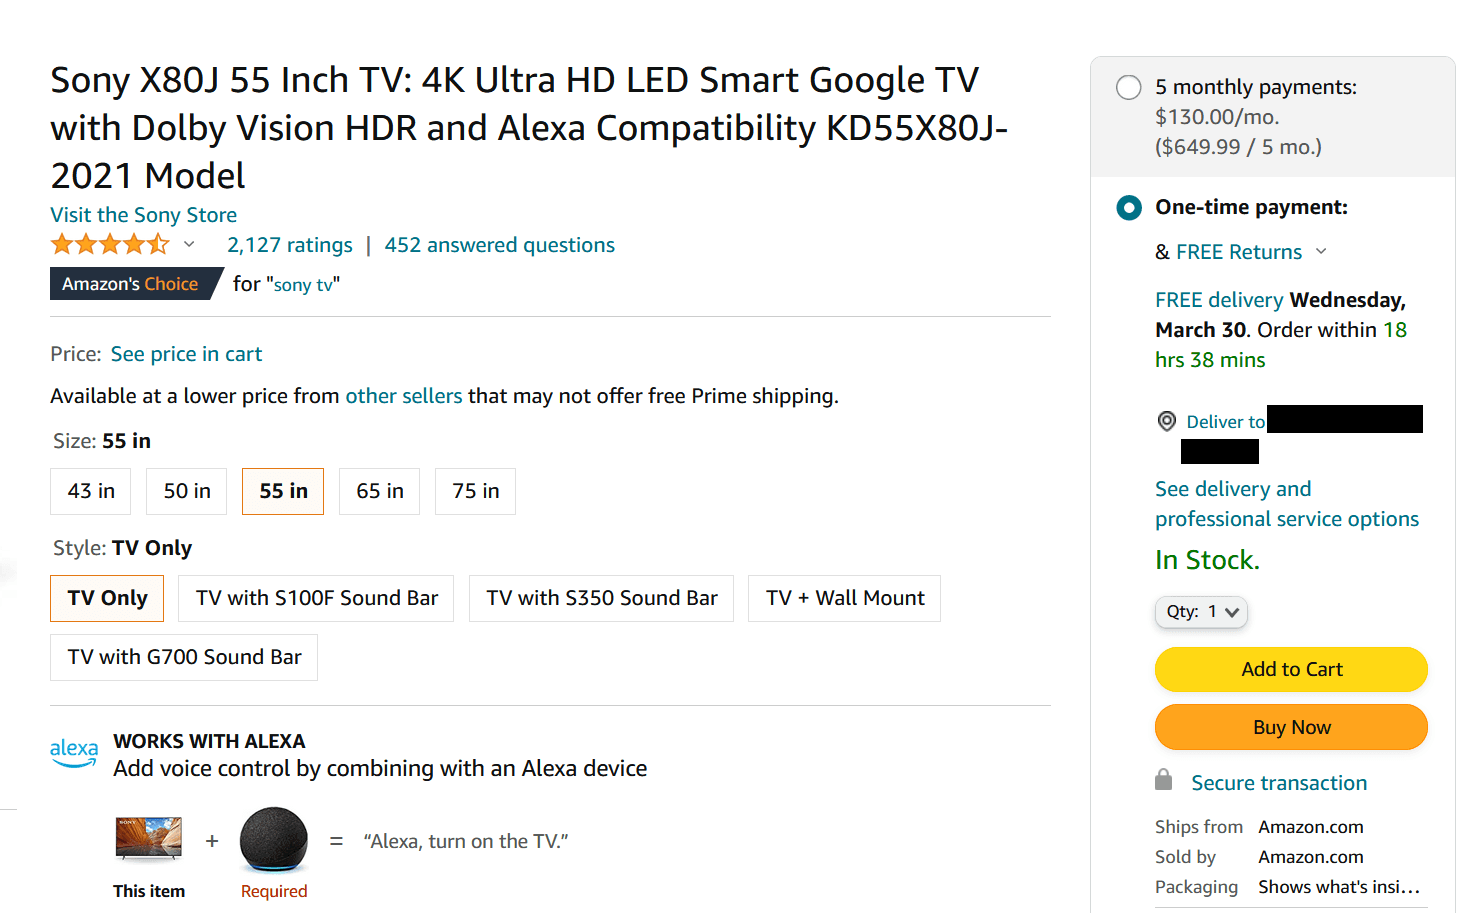
The Amazon buy box includes the Add to Cart and Buy Now buttons at right, and are highly visible to customers. [/caption]
Amazon’s buy box (or “featured offer”) is a unique brand management challenge. For most retailers, it’s enough to offer competitive costs, trade terms, and marketing support. But Amazon’s price matching strategy forces brands to go much further to ensure their products are available for customers with profitable margin. They constantly crawl competitor websites looking for lower prices. What happens when they find one?
Amazon matches the competitor price, then asks you for funding to bridge the cost of the price match. Some vendor managers will ask you to write them a check (straight payment) for the full amount of the price match discount—even if it’s greater than your COGS.
You lose the buy box or featured offer to a third-party seller’s listing on your ASIN. This happens most often when there is a competitively-priced, Prime-eligible 3P offer available for that customer, and Amazon has determined that their profit from 3P fees is greater than the profit of selling their (your) inventory at the matched priced.
Amazon removes the buy box or featured offer entirely. In some rare instances, when there is no 3P offer and the unit economics of price matching are unsustainable, Amazon may choose to make the product unbuyable. The buy box will say “Currently unavailable,” and Amazon will often advertise competing alternatives at the top of your detail page. Amazon tries to avoid this because it’s a bad customer experience, especially when the product is available from competitors.
——
Or worst of all, you might be impacted by all three outcomes at once. Picture this scenario:
One of your smaller retailers goes out of business and liquidates their remaining inventory of your product at 50% of COGS.
Amazon matches the clearance pricing and loses money on every unit.
The lower price drives up customer demand, and Amazon sells through your inventory. The price goes viral for a day on TikTok.
Many independent sellers buy up the clearance inventory from the small retailer AND Amazon, then relist it as FBA sellers. Now there are hundreds or thousands of units on the market that can be profitably sold under your cost.
Meanwhile, other retailers have noticed and are asking for price support and concessions, while POs keep coming in.
The price of your product stays artificially low—in some cases funded by you—and the entire market goes out of stock.
You’re “Currently unavailable” on Amazon and your demand goes to competitors.
It’s a nightmare scenario that happens all the time. This is why monitoring your buy box win rate is critical.
How to measure lost buy box and lost featured offer rates With Vendor Central
Amazon made tracking LBB and LFO extremely difficult for brands by removing lost buy box data from Vendor Central and the SP-API. Brands were forced to rely on third-party scrapers that measured win rates.
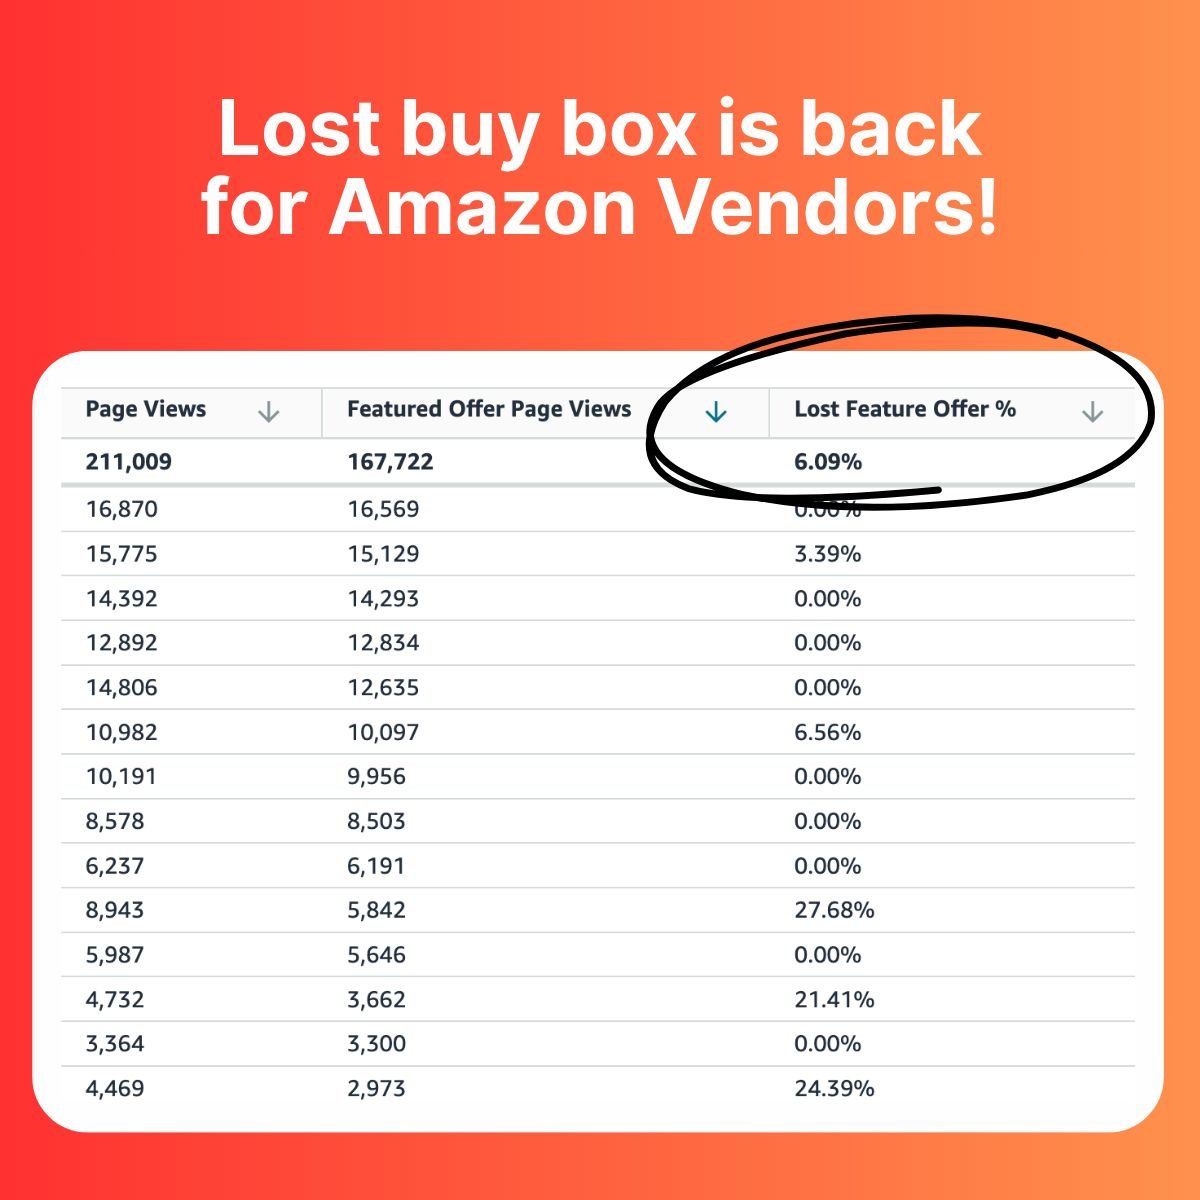
But Amazon is publishing Lost Featured Offer % to a small subset of vendors. There was no announcement, it’s simply available in the Retail Analytics Traffic report for some vendors in some marketplaces. If you have access to this new experience, you’ll notice that Amazon completely overhauled their traffic terms and definitions.
Addition of Page Views. Measures total traffic to the detail page, regardless of whose offer is featured. While sellers have had access to page view data for years, this is the first chance for vendors to understand total traffic to their detail pages.
Renaming of Glance Views to Featured Offer Page Views. This is a naming change only: featured offer page views and glance views are the same. The new name makes it clear that FOPVs are only registered when 1P retail is winning the buy box / is the featured offer.
Addition of Lost Feature Offer %. This is Amazon’s replacement for LBB%. It is the percentage of the time that the vendor is not winning the buy box while Amazon has inventory. In other words, LFO% is not simply FOPV / PV. To completely bridge traffic, brands must also include procurable OOS (Proc OOS%) from Retail Analytics Inventory. Taken together this shows all critical traffic metrics:
Total traffic (Page views)
Traffic while out of stock (Proc OOS%)
Traffic while in stock but losing the buy box (LFO %)
These new metrics, when available, help vendors model the impact of operational and pricing decisions on traffic and product availability.
How to Estimate lost buy box With Third-party Trackers
Although buy box information is inconsistently available to brands directly from Amazon, there are many tools that help you approximate buy box ownership by scraping Amazon’s website.
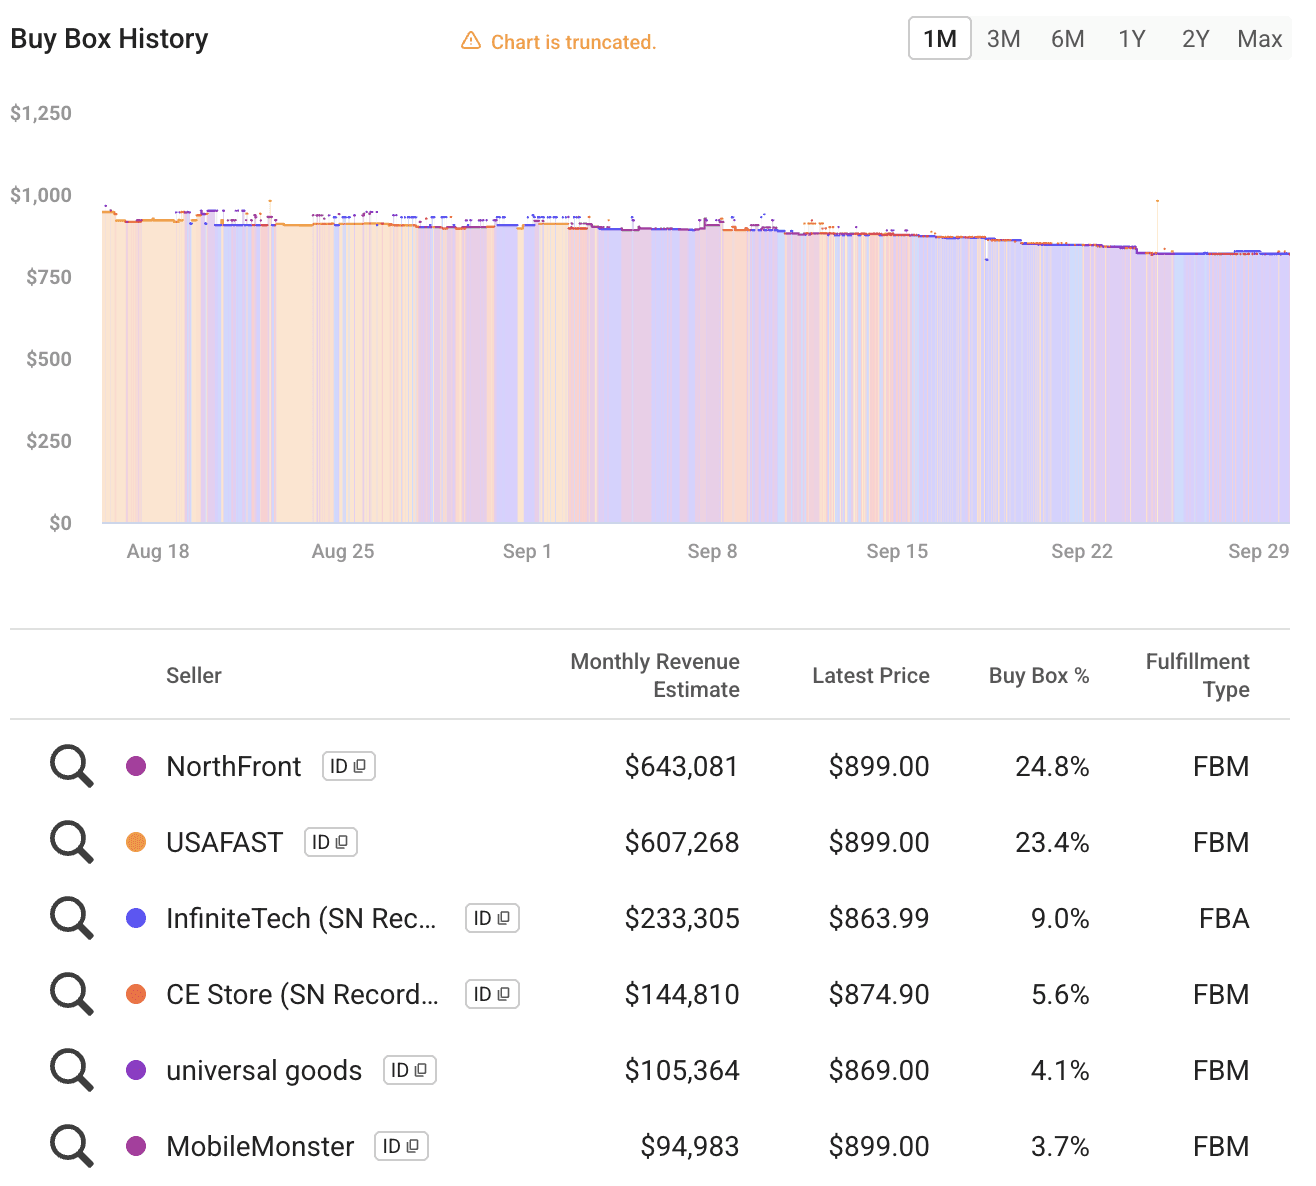
Tools like SmartScout estimate every seller’s share of the buy box (including Amazon) by scraping the public website multiple times per day. While no third party tool is perfect, these buy box estimates can be very accurate, especially for popular items.
When to use third-party tools:
For monitoring limited selection, not your entire catalog. SmartScout is great for researching products and categories.
For contentious ASINs with multiple third-party sellers fighting for the buy box.
For products with strong national distribution. The buy box winner is determined individually for a given customer, and it can be different for two different customers at the same time, if they are located in different parts of the country with different stock in nearby fulfillment centers. This will be exacerbated as Amazon unwinds inventory commingling, because Amazon will no longer ship other sellers’ inventory to fulfill your demand.
Beyond Buy Box %: How Buyability and Discoverability Issues Hurt your Amazon Sales
[caption id="" align="alignnone" width="518"]
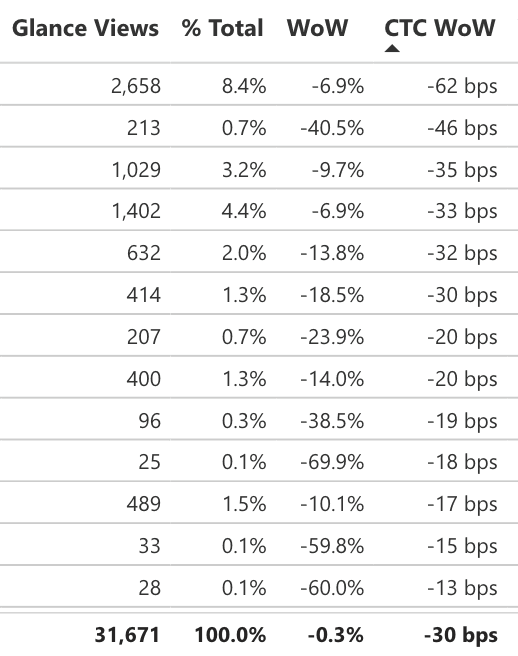
Look for major drivers of traffic declines to spot suppressions. [/caption]
Buy Box and Lost Featured Offer metrics have a critical weakness: they only measure buy box loss for traffic that reaches your detail page. What happens if your product is suppressed from search, or the Amazon retail offer is removed? Your LFO% might look deceptively healthy because it only measures buy box loss to competing offers on eligible traffic—not declines in total traffic driven by suppressions.
This is why it’s important to look for outliers every week: ASINs or product groups that drive major traffic declines week-over-week or month-over-month. These are often an indicator of soft suppressions.
The best tools make this easy by calculating contribution to change (CTC). This metric quantifies exactly how much individual ASINs or product groups contributed to the total change you saw for your business. In this screenshot example, traffic declined -0.3% week-over-week (WoW), or 30 basis points (bps).
When does Amazon change an ASIN’s buyability or discoverability?
While there are hundreds or thousands of possible reasons for search suppression and offer removal, here are some of the common themes:
Content policy violations. From main image issues to copyright violations, Amazon pulls offers when your content breaks the rules.
Rejected costs. You tried to upload a new cost that was rejected by Amazon’s system.
Missing data. One or more critical product attributes is missing from your catalog data. Most commonly seen when the data is necessary for compliance or safety.
Invalid attribute content. You submitted catalog information that did not pass Amazon’s validation requirements, such as exceeding maximum length, using text when a number is expected, or including an unrecognized field in your submission.
Automated changes. Frustratingly, Amazon’s systems will often make catalog and product content changes without your knowledge or permission. For example, Amazon may change the Product Type of your ASIN and require you to accept the change before they will restore the retail offer.
Forbidden changes. You changed an attribute that must be modified directly by Amazon, e.g. by a vendor manager, because it is restricted. Again most common when the data is compliance-related.
For an unknown reason. 10-30% of the average vendor’s buyability and discoverability notifications are for unknown reasons because they transmit with a “Blank” error type, and no other information.
How to manage Amazon 1P buyability and discoverability
Amazon shares buyability and discoverability notifications in Vendor Central and through the Notifications API. But many companies struggle to use the information because Amazon does not store your notification history and there’s no way to export previous data; you have to actively listen for notifications.
Worse, your notification volume is a function of your catalog size. Brands with hundreds or thousands of ASINs might receive dozens or hundreds of notifications per day, which must be interpreted and triaged.
And the notifications don’t contain all the information you need about the related attributes and impacted products.
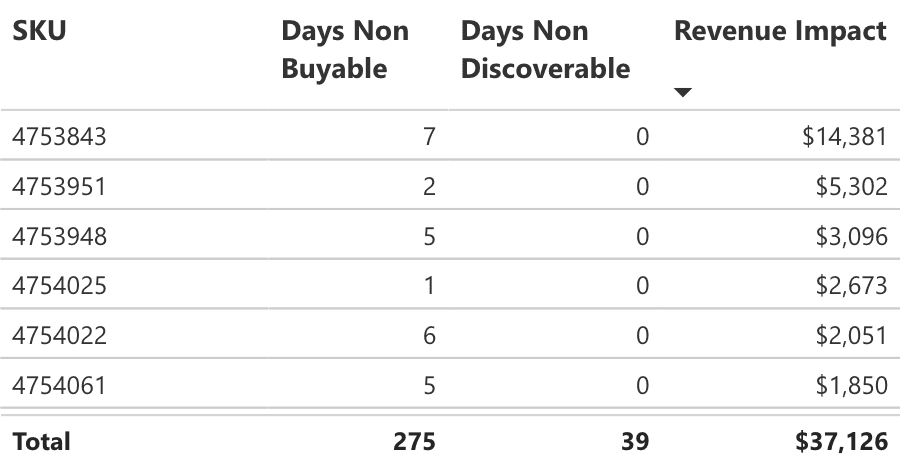
That’s why strategic brands use tools like BASIS to store, enhance, and categorize their notification data.
BASIS helps you identify the top products and issue themes by revenue impact. This helps your sales and operations teams prioritize which individual issues or products to work on.