Andrew Hamada
|
Amazon Glance Views and featured offer page views: About Vendor Central Traffic & Conversion Data
Guides & How-to
For more than 20 years, Amazon’s traffic and conversion data was a closely-guarded secret. Amazon did not disclose to vendors how many page hits (“glance views”) their products received. This prevented vendors from understanding how much traffic each category gets, and how effectively that traffic is converted into sales by Amazon’s website.
In November 2020, Amazon finally made glance view and conversion data available in Vendor Central to all brands through Sales Diagnostic reporting. It was a shocking development as brands understood page conversion rates for the first time, and began to optimize content and pricing accordingly.
Now in 2025, brand managers can access up to three years of daily traffic data by ASIN, alongside sales, inventory, net PPM, and other sell-out metrics.
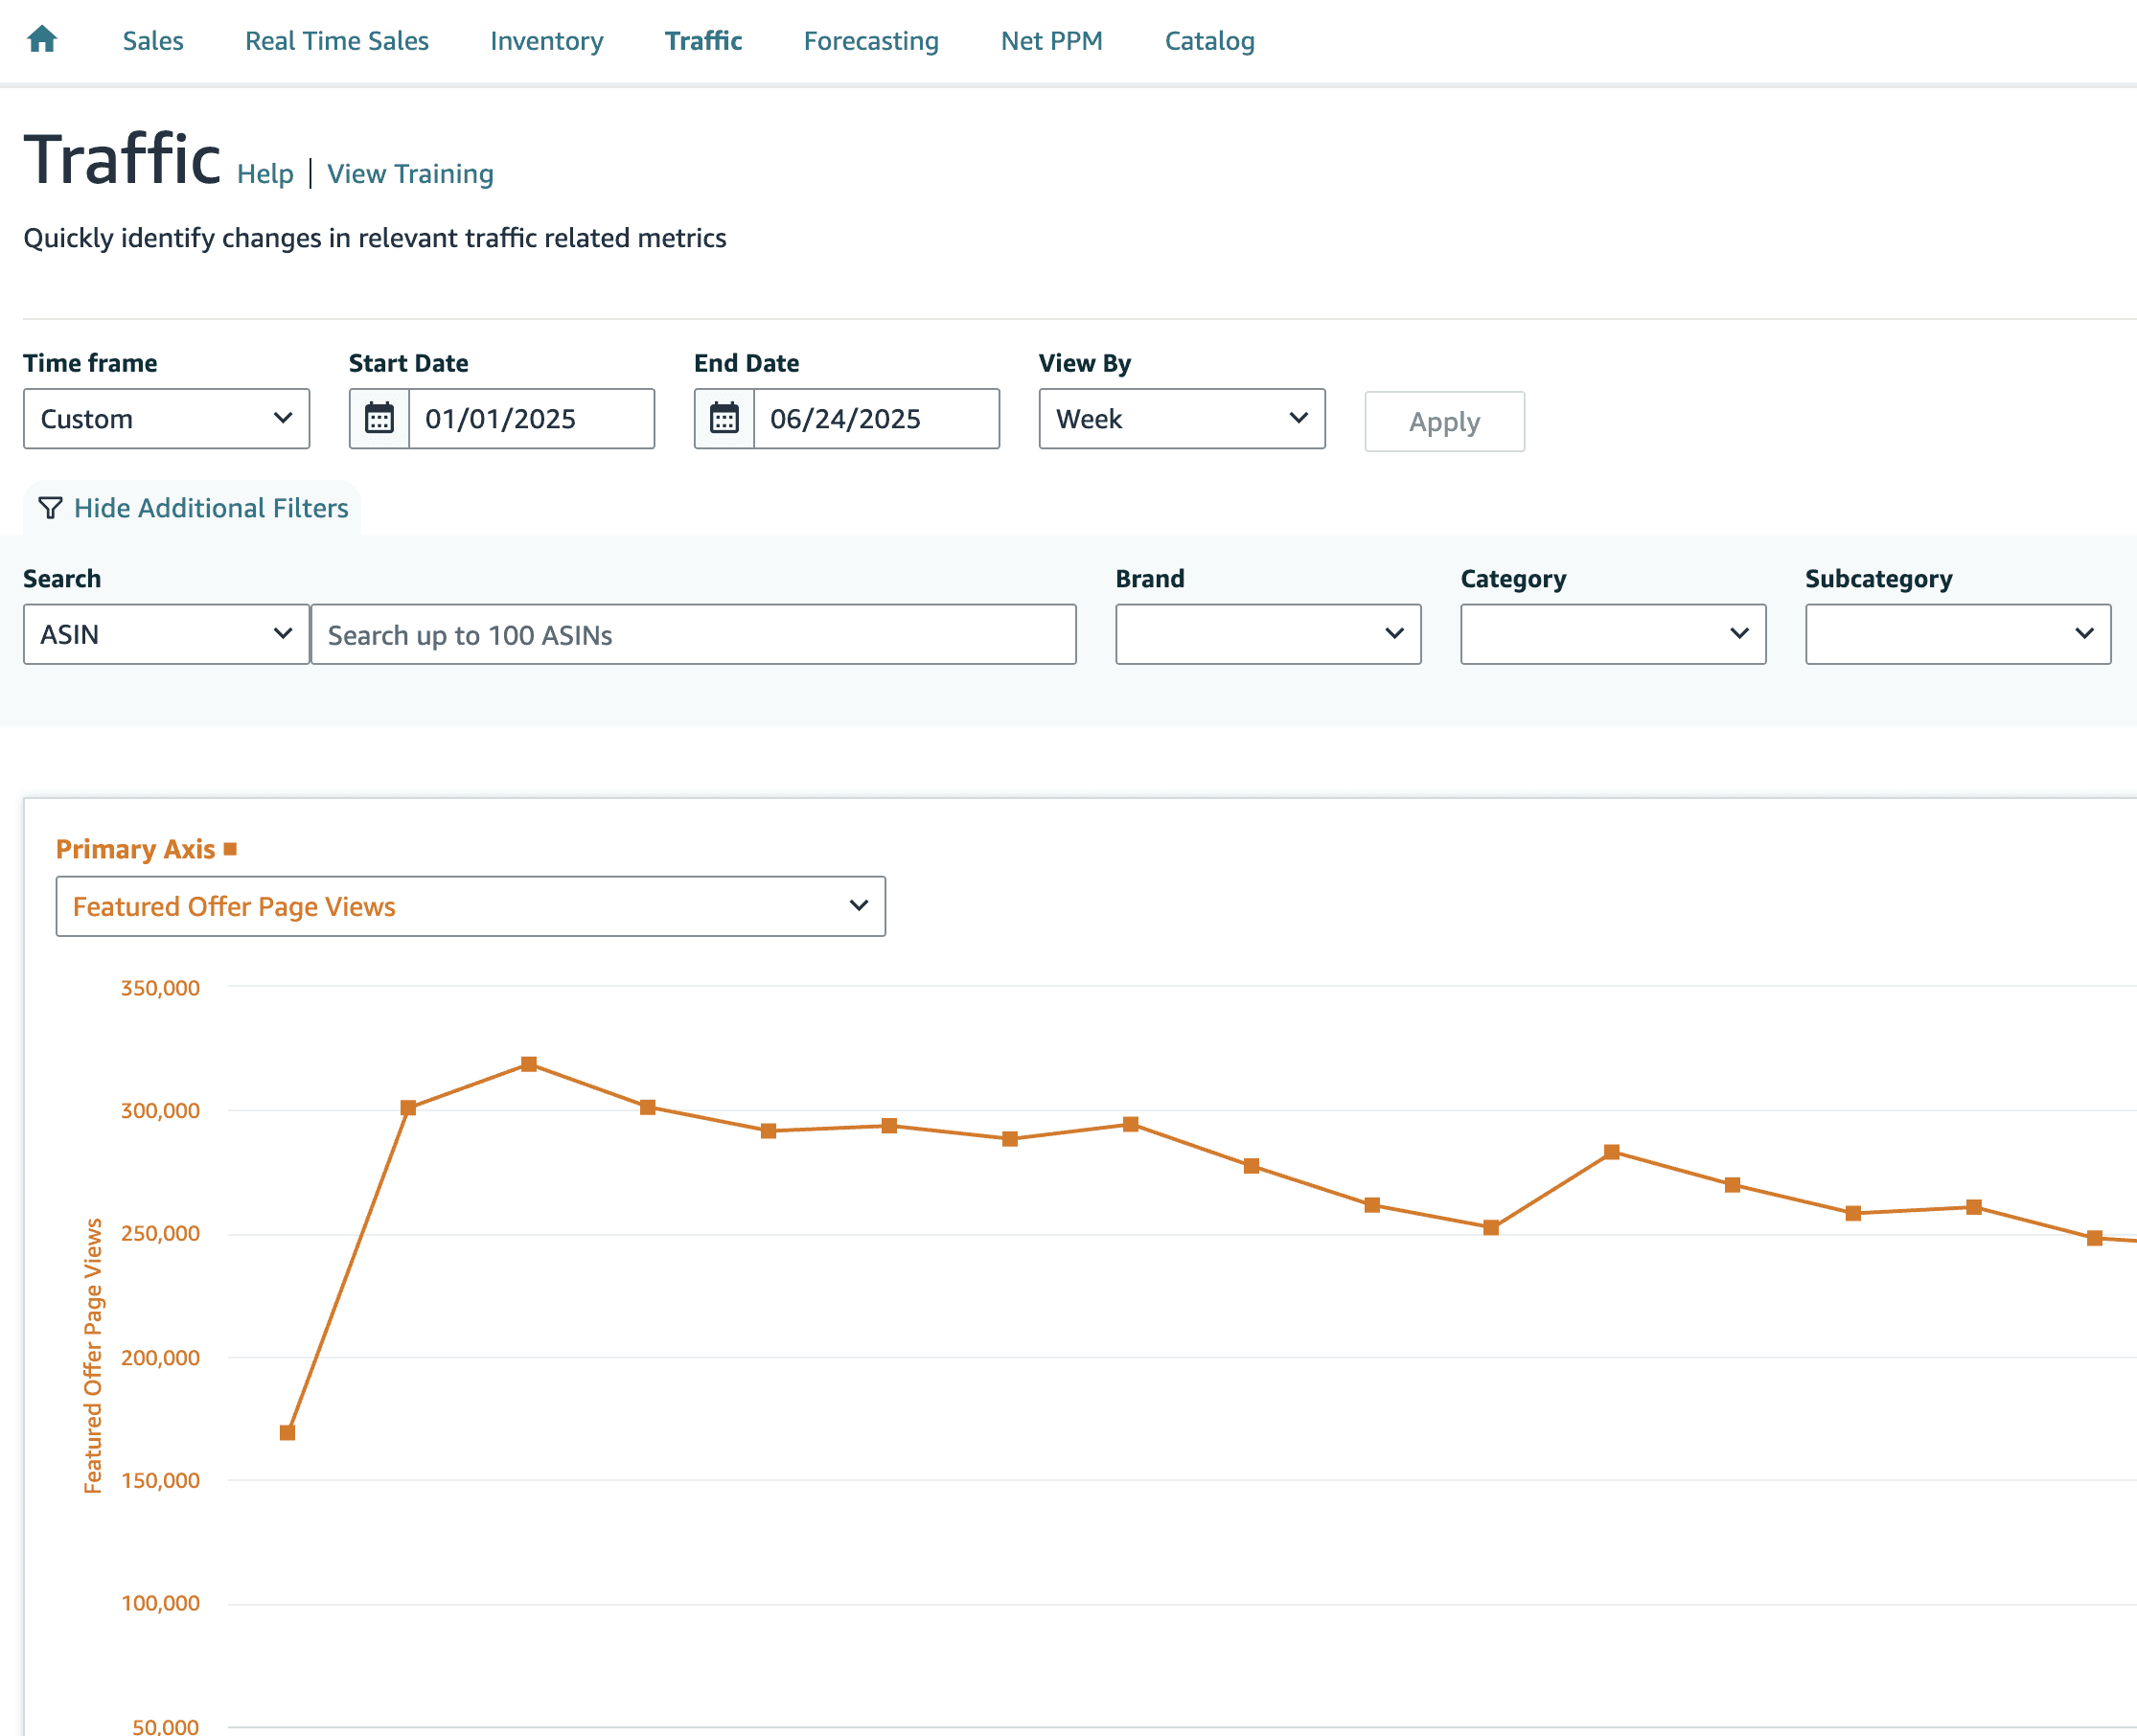
You can find the Vendor Central traffic report by logging into Vendor Central and going to Reports > Retail Analytics > Traffic. Within this report, you'll find data on glance views or “featured offer page views,” which is the traffic data metric vendors should be most concerned about.
What Are Glance Views (GVs)? HOW AMAZON MEASURES DETAIL PAGE TRAFFIC
Glance views are one way that Amazon measures traffic to product detail pages. There are three main traffic metrics to be aware of:
1. GLANCE VIEWS / FEATURED OFFER PAGE VIEWS
Glance views represent the number of times your product detail pages are viewed. They are not deduplicated, so 15 glance views might be visits from 15 different people or all from one person. Glance views (or GVs) are the only traffic metric available to vendors. GVs are great for modeling conversion rate but less useful for modeling customer acquisition.
Glance views are only counted when a retail (1P) offer is featured (i.e. winning the buy box). Glance views do not include traffic when a third-party (3P) offer is featured. In other words,
Glance views are only available in manufacturing view in Retail Analytics in Vendor Central and via Amazon’s SP-API.
In 2025, glance views were renamed to featured offer page views (FOPVs) in Vendor Central, but the definition and data remained same. The new name makes it clearer that views are only counted when retail is the featured offer.
This change also makes it clearer that page views are the same traffic measure for vendors and sellers.
As of Q4 2025 this metric is being released with very limited availability.
2. SESSIONS
Sessions represent unique shopper visits to ASIN detail pages. A single session lasts 24 hours and can include multiple glance views from the same shopper. Internally, Amazon divides sessions into recognized (from signed-in customers) and unrecognized (from signed-out users).
Sessions are useful for understanding customer acquisition, but unfortunately are not available to 1P vendors at this time.
3P sellers, on the other hand, can access session data through Seller Central and the SP-API.
Amazon has not shared any plans to make sessions available to vendors.
3. PAGE VIEWS
Page views represent the number of times the product detail page was viewed. However, unlike Glance Views or Featured Offer Page Views, page views do not exclude traffic when third-party (3P) offers are featured. The metric is only available to sellers through Seller Central and the SP-API.
What about SPONSORED ADS AND BRAND STORES?
Amazon provides many other related marketing and advertising metrics that are not a type of detail page traffic.
Sponsored Advertising and DSP impressions. Impressions mean someone (theoretically) saw your ad, but detail page traffic only occurs when they click through to the product detail page.
Brand store visits and views. Traffic to your brand store is similar to advertising impressions: they might lead to detail page traffic, but should be treated as a separate part of the funnel.
Search impressions. These represent the number of times your product appeared in search results. Amazon includes add to cart buttons in search results, so it can be tempting to treat search impressions like

CALCULATING YOUR AMAZON Conversion Rate
For years, brands were forced to guess about their Amazon conversion rates. Amazon doesn’t calculate it for you, but they give brands everything you need to create basic conversion reporting.
Glance views: The number of times customers visited your product detail pages while you were in stock. (Retail Analytics Traffic)
Ordered units: The number of units purchased by customers. You can combine this data directly with your glance views data to come up with a basic conversion rate for each of your products. It’s important to use ordered units rather than shipped units to align the glance view date and the order date. (Retail Analytics Sales)
Procurable product out-of-stock (OOS): Although it is not a direct input to your conversion rate, Procurable Product OOS is an important context metric that shows how often your offer was out of stock when a customer visited the detail page. (Retail Analytics Inventory)
These metrics are all available from Vendor Central or the SP-API in the Manufacturing distributor view.
Can Traffic Data Help Vendors Calculate Lost Buy Box (LBB) OR LOST FEATURED OFFER (LFO) RATES?
The short answer is: no. One of the biggest losses for vendors with the Amazon Retail Analytics relaunch in 2022 was the deprecation of the Lost Buy Box metric. Vendors relied on the LBB metric to quantify the missed-revenue impact of losing the buy box, from going out of stock or by being underpriced by a third-party seller.
Without the LBB metric, it’s almost impossible for vendors to quantify what is going on. It’s unfortunately not possible to back into your LBB% from any metrics that Amazon provides. Some brands have resorted to detail page scraping—using bots that check your detail pages multiple times per day to see whether Amazon is winning the featured offer. This method is error-prone and doesn’t scale well, but may be the only substitute available to brands.
How to diagnose a problem or decline in your traffic data
1. Look for High/Low Performers
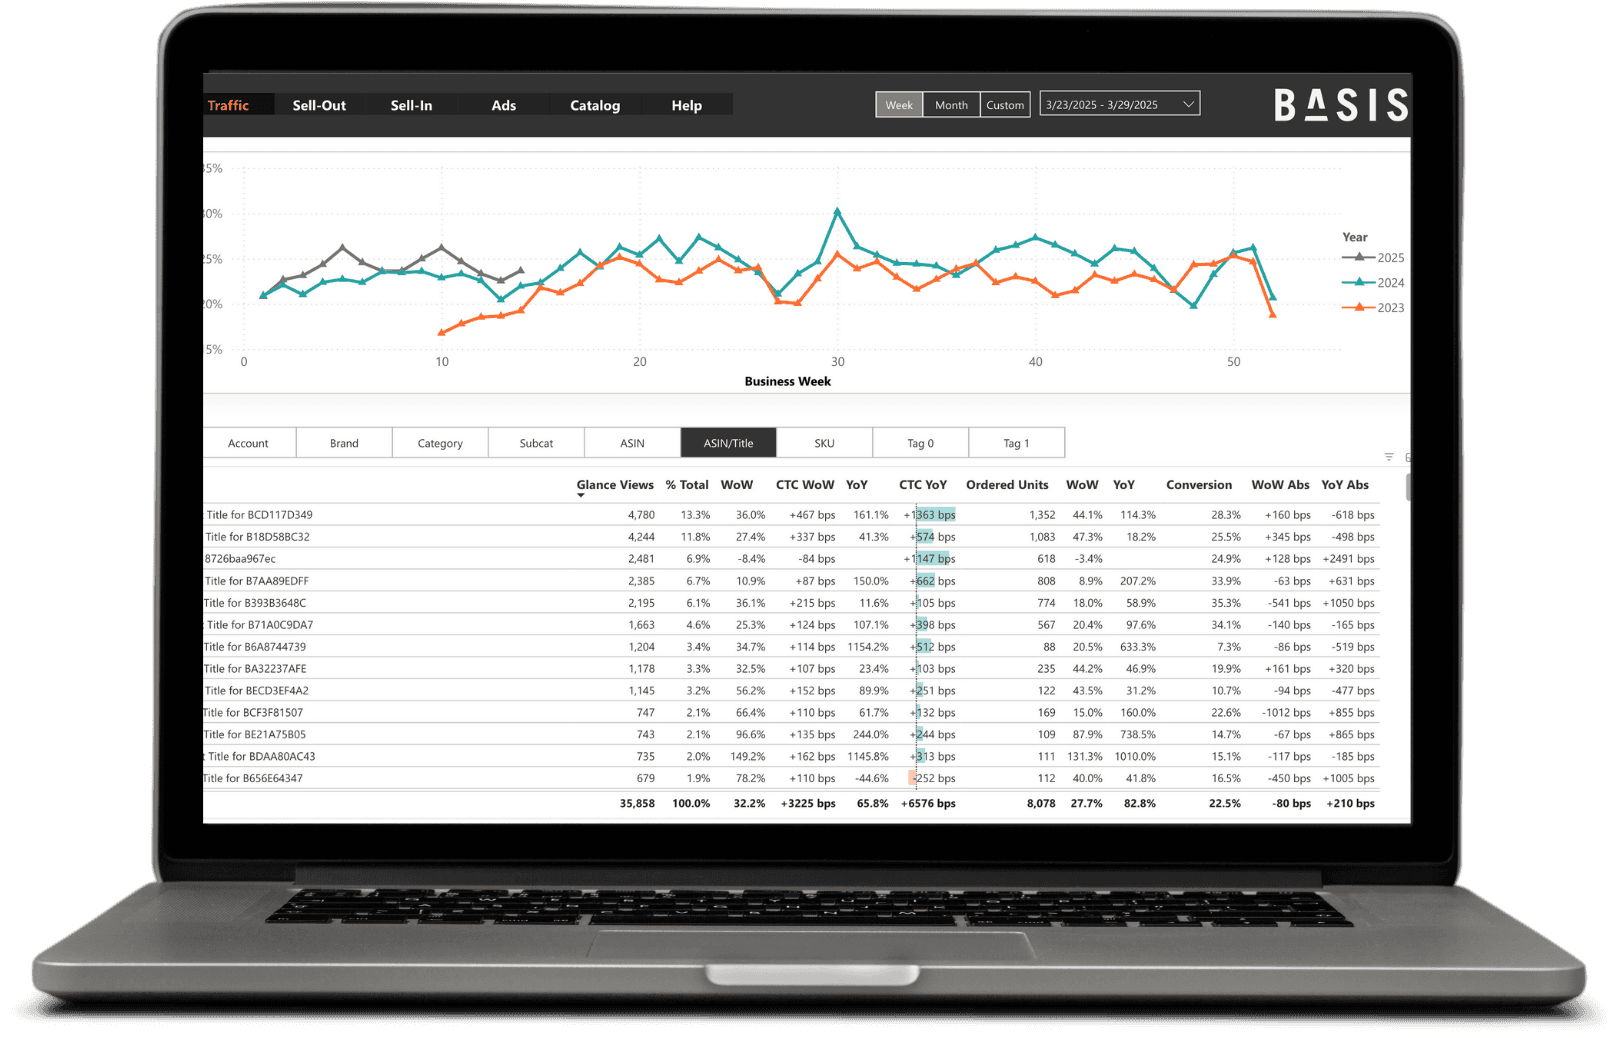
Look for ASINs, categories, or product lines with strong positive or negative impacts on traffic growth. Tools like Reason Automation’s BASIS make this easy by calculating contribution to change, quantifying exactly what drove changes at any granularity.
This technique makes it easy to spot outliers and traffic-driving stories, such as:
Products that went viral
Out-of-stocks
Post-deal traffic declines
Ad campaign launches or completions
New competitor launches
2. Check for catalog changes
Catalog accuracy can have a major impact on detail page traffic, and data accuracy in Vendor Central. Unfortunately, catalog changes are one of the most common sources of data discrepancies and changes in product discoverability for vendors.
Broken variations. Variations and ASIN relationships are critical for driving traffic to long-tail selection, especially for categories like Apparel with dozens of variations per product. Sometimes, Amazon systems or accidental user errors can break variations unexpectedly. Amazon does not surface these errors, and makes it difficult to see broken ASIN relationships. Use dashboards or data to quickly spot changes in Parent-Child ASIN relationships that may indicate a broken variation.
Added or missing ASINs. ASINs can be added or removed from your Manufacturer or Brand code. Sometimes this happens correctly, like when a brand is sold. Mostly, it happens incorrectly when an Amazon system error randomly dissociates one of your products from your Manufacturing view in Retail Analytics, or incorrectly associates another brand’s product. These changes can cause major traffic discrepancies, e.g. when a best-selling item suddenly drops out of Manufacturing view.
3. Track buyability, discoverability, and Suppression issues
Amazon has different ways of limiting how customers can engage with your products.
Non-buyable: Amazon has removed your retail 1P offer from the product because of an issue. The issue could be severe, such as an Andon cord, or a technical error like an invalid catalog attribute. The ASIN still appears in search results, but without a retail offer, may quickly lose sales velocity and search rank.
Non-discoverable: a more severe condition where Amazon removes a product from search results, making it impossible for customers to discover unless they go directly to the detail page URL. This is typically driven by more severe issues, such as unprofitability, or a customer safety issue.