Andrew Hamada
|
Contribution to Change (CTC): The Framework Behind Amazon's Business Reviews
General
Every week, ecommerce leaders face the same question: what changed, and why?
Your VP wants a clear narrative. Your Amazon vendor manager wants to know what's driving (or dragging) performance. And building that narrative from scratch in Excel takes hours you don't have.
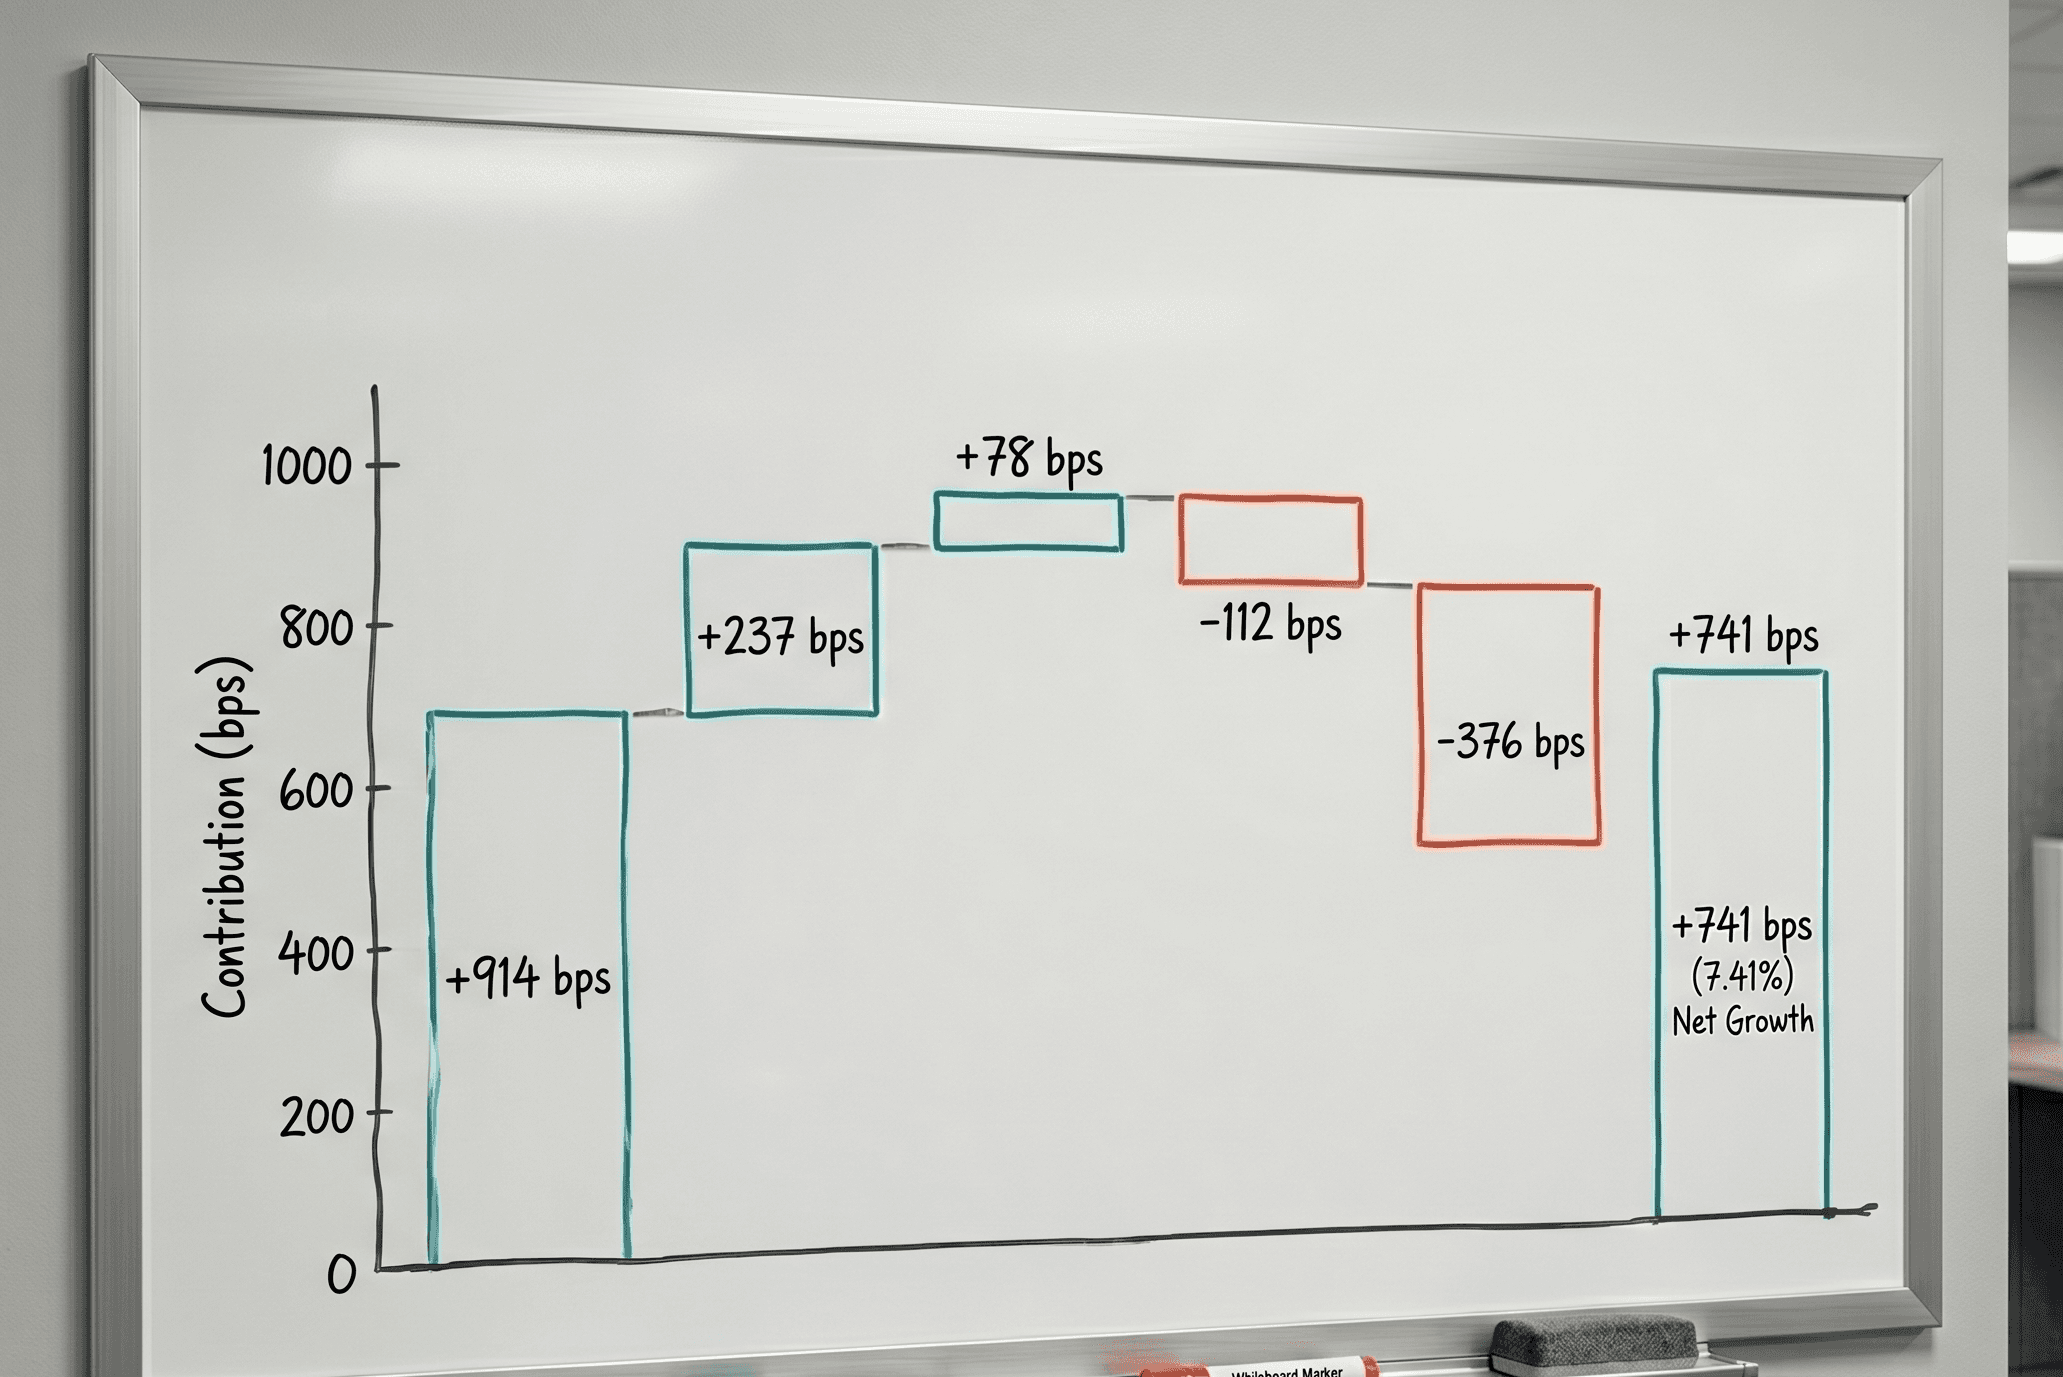
One of our customers had a flat week. Growth dropped to 1% YoY after running at 15%+ for months. The initial read was "sales growth slowed." But when they decomposed the change by product, the story was different: one top ASIN had a steep decline, offset by strong gains across six long-tail products. The problem wasn't the business. It was a single product issue.
That's the kind of insight that changes the conversation. And it's exactly what Contribution to Change is designed to surface.
What is Contribution to Change?
Contribution to Change (CTC) is a framework that breaks down a total change in a metric (revenue, units, profit, margin) into the individual contributions of each product, category, or segment. Instead of saying "revenue grew 8%," CTC tells you which products drove that growth, which ones dragged it down, and by how much.
If you've spent time inside Amazon, you've seen CTC in action. Amazon's internal business reviews are built around it. Rooms of senior leaders reading through 80+ pages of printed Excel tables, minimal charts, each person speaking to their domain with a precise, data-backed narrative about what moved and why. CTC is the analytical backbone that makes those conversations possible.
CTC and Mix-Rate Analysis
CTC is closely related to mix-rate analysis, and the two work well together. Mix-rate analysis focuses on compositional shifts: the ratio of premium SKUs to entry-level, high-margin products versus low-margin, or one category growing faster than another. CTC quantifies those shifts by showing exactly how much each product or segment contributed to the total change.
For example, you might observe that your average selling price declined. Mix-rate analysis tells you the sales mix shifted toward lower-priced products. CTC tells you which specific products drove that shift and how much each one contributed to the overall ASP decline. That distinction matters when you're deciding where to act. It's the difference between "ASP is dropping" and "ASP dropped $2.40 because Product X grew 35% while our premium line was flat."
CTC grounds your narrative in measurable impact, making it easier to explain performance trends to internal stakeholders, agency partners, and Amazon vendor managers with precision and confidence.
Setting up CTC Analysis in Excel
[caption id="" align="alignnone" width="2154"]
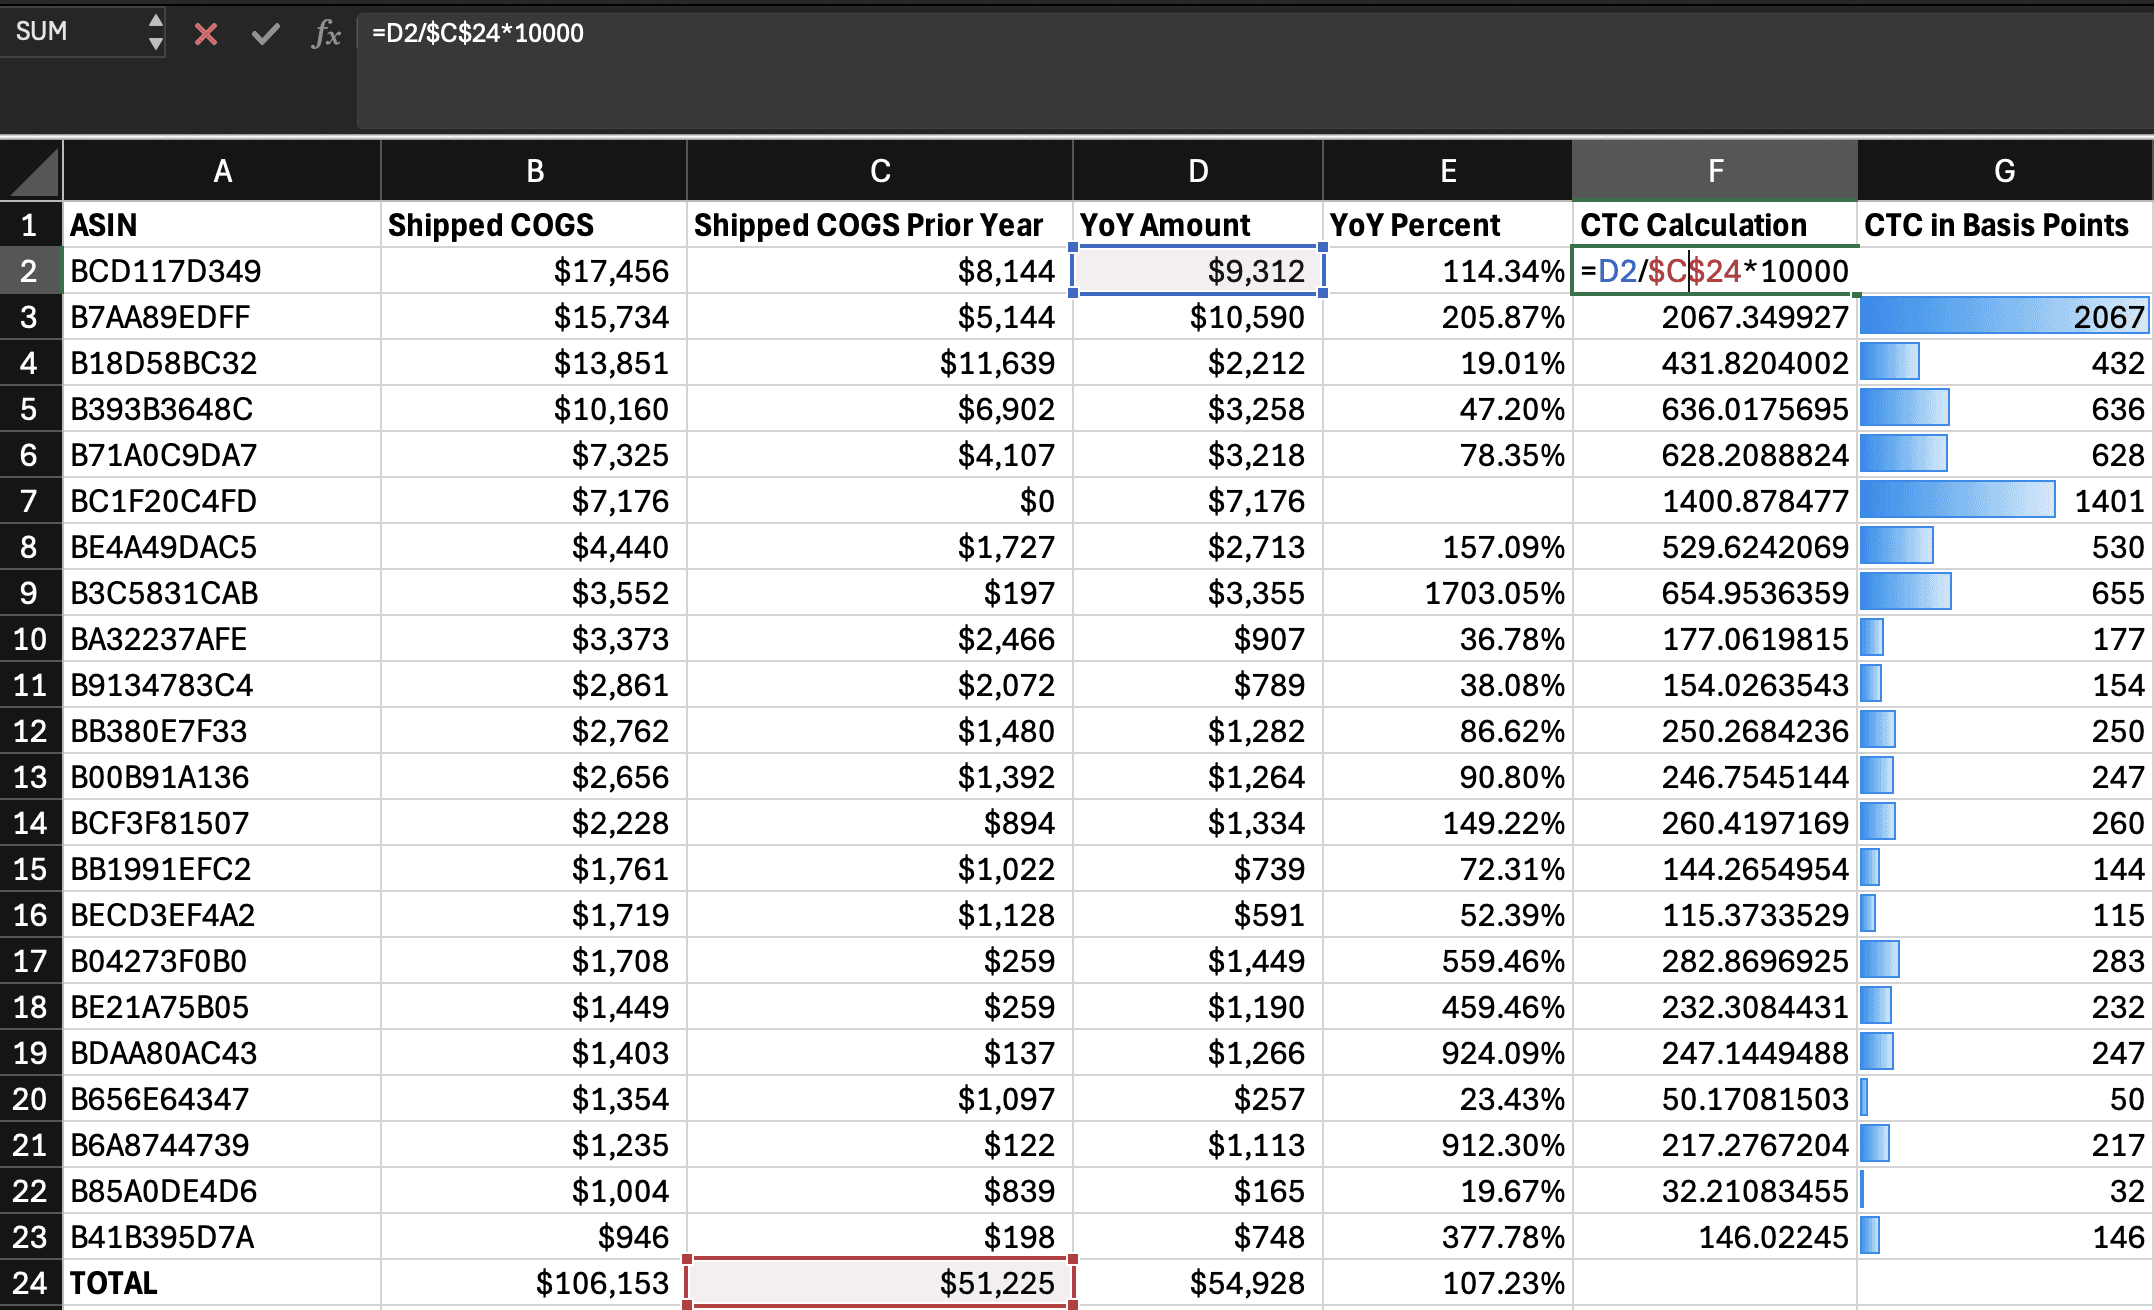
An example Excel workbook using CTC to determine relative contribution to shipped COGS YoY growth. [/caption]
Most reporting starts with sell-out analysis. Set up a contribution-to-change report for your ASINs in less than 30 minutes.
1. DOWNLOAD SALES REPORTS
In Vendor Central, go to Retail Analytics → Sales.
Make sure you use the same granularity (e.g. weekly) and distributor view (e.g. Manufacturing).
Download the current and prior report periods.
2. COMBINE THE DATA
Open both downloads in Excel. You want to create a single sheet with sales from both periods by ASIN.
Copy both downloads into their own sheets in the same workbook (label them “current” and “prior”).
Create a third sheet for your combined view.
List all ASINs from either period.
Use VLOOKUP or XLOOKUP to bring in shipped COGS for each ASIN from both time periods.
3. CALCULATE CHANGES
Add a column for absolute change in shipped COGS (Current - Prior). In our example it’s called “YoY Amount.”
Add a total row to sum both periods and calculate total growth rate.
4. CALCULATE CTC
For each ASIN, divide YoY amount of the ASIN by the total amount of the prior period.
The result should be a decimal. Multiply by 10000 (ten thousand) to convert into basis points.
The sum of basis points for all ASINS should equal the YoY change.
This gives you a clear, sortable metric that shows how much each ASIN contributed to the overall YoY change.