David Ingram
|
Amazon Vendor Central Currency Conversion: What's Wrong and How to Fix It
General

If you sell on Amazon across multiple countries, you already know that currency conversion is more than a cosmetic detail. Exchange rate shifts affect revenue, distort growth metrics, and can make the same business look dramatically different depending on the currency in which you‘re reporting.
A client recently flagged exactly this: their dashboard showed 24% year-over-year sales growth in EUR but only 13.9% growth in GBP, for the same business, the same products, the same time period. The gap was entirely currency-driven. No volume change, no pricing change—just foreign exchange.
That's a real and meaningful distortion. And if you're a finance or sales leader managing a pan-European Amazon business, it's one you're probably running into more than you realize.
How Vendor Central Handles Currency Conversion
There are three reasonable ways to model revenue growth across currencies:
Unit growth only: eliminates both currency and ASP effects entirely
A fixed peg rate: eliminates currency effects, preserving ASP and volume
Time-of-event conversion: uses actual daily exchange rates, capturing everything
Amazon uses option two in Retail Analytics. That's a defensible choice in isolation. A stable peg rate gives you cleaner period-over-period comparisons without exchange rate noise. The problem is in the execution.
Amazon uses a fixed peg rate, and rarely updates it
You can reverse-engineer the exchange rate Amazon is applying by switching your selected currency in Vendor Central and comparing the same metric (e.g., Shipped COGS) across both views.
For the UK Vendor Central account below, that exercise returned an implied rate of 1.2086 EUR per GBP, applied consistently across every date we tested, going back to at least late 2023.
XE.com puts the actual average EUR/GBP rate at approximately 1.1676 for 2024 to present, a meaningful gap. Why Amazon does this isn't clear. But what's clear is that it creates real problems for vendors by masking forex impact on your financials.
In the example below, the Difference column shows the impact of the rate gap on a vendor business: over € 90,000.
Why This Matters
It Obscures the Real Impact of Foreign Exchange
Currency markets move. GBP/USD swung over 10% between 2023 and 2024. EUR/GBP has seen comparable volatility. For brands selling across GB and the EU, those swings directly affect the economics of the business: cost structures, profitability, and competitive dynamics.
A static peg rate doesn't capture any of it. At best, it's slightly misleading. During periods of real volatility, it's significantly misleading.
It Distorts Your View of International Performance
Pan-European Amazon vendors often manage UK and EU businesses in separate Vendor Central accounts, in separate currencies. Getting an accurate consolidated view already requires work. Amazon's stale, fixed rate makes it harder because the converted numbers don't reflect what actually happened in the market.
If you're trying to understand whether your UK or DE business is outperforming, or how a pricing change affected revenue relative to the prior year, Amazon's currency conversion doesn't give you a reliable foundation for that analysis.
It's Useless for Finance and Reconciliation
Amazon's currency conversion in Retail Analytics is not built for accounting. No finance team should be using it to reconcile payments, validate deductions, or report to management. The numbers simply won't tie out to actuals, and during periods of high exchange rate volatility, the gap can be substantial.
The Right Approach: Daily Exchange Rates
[caption id="" align="alignnone" width="2310"]
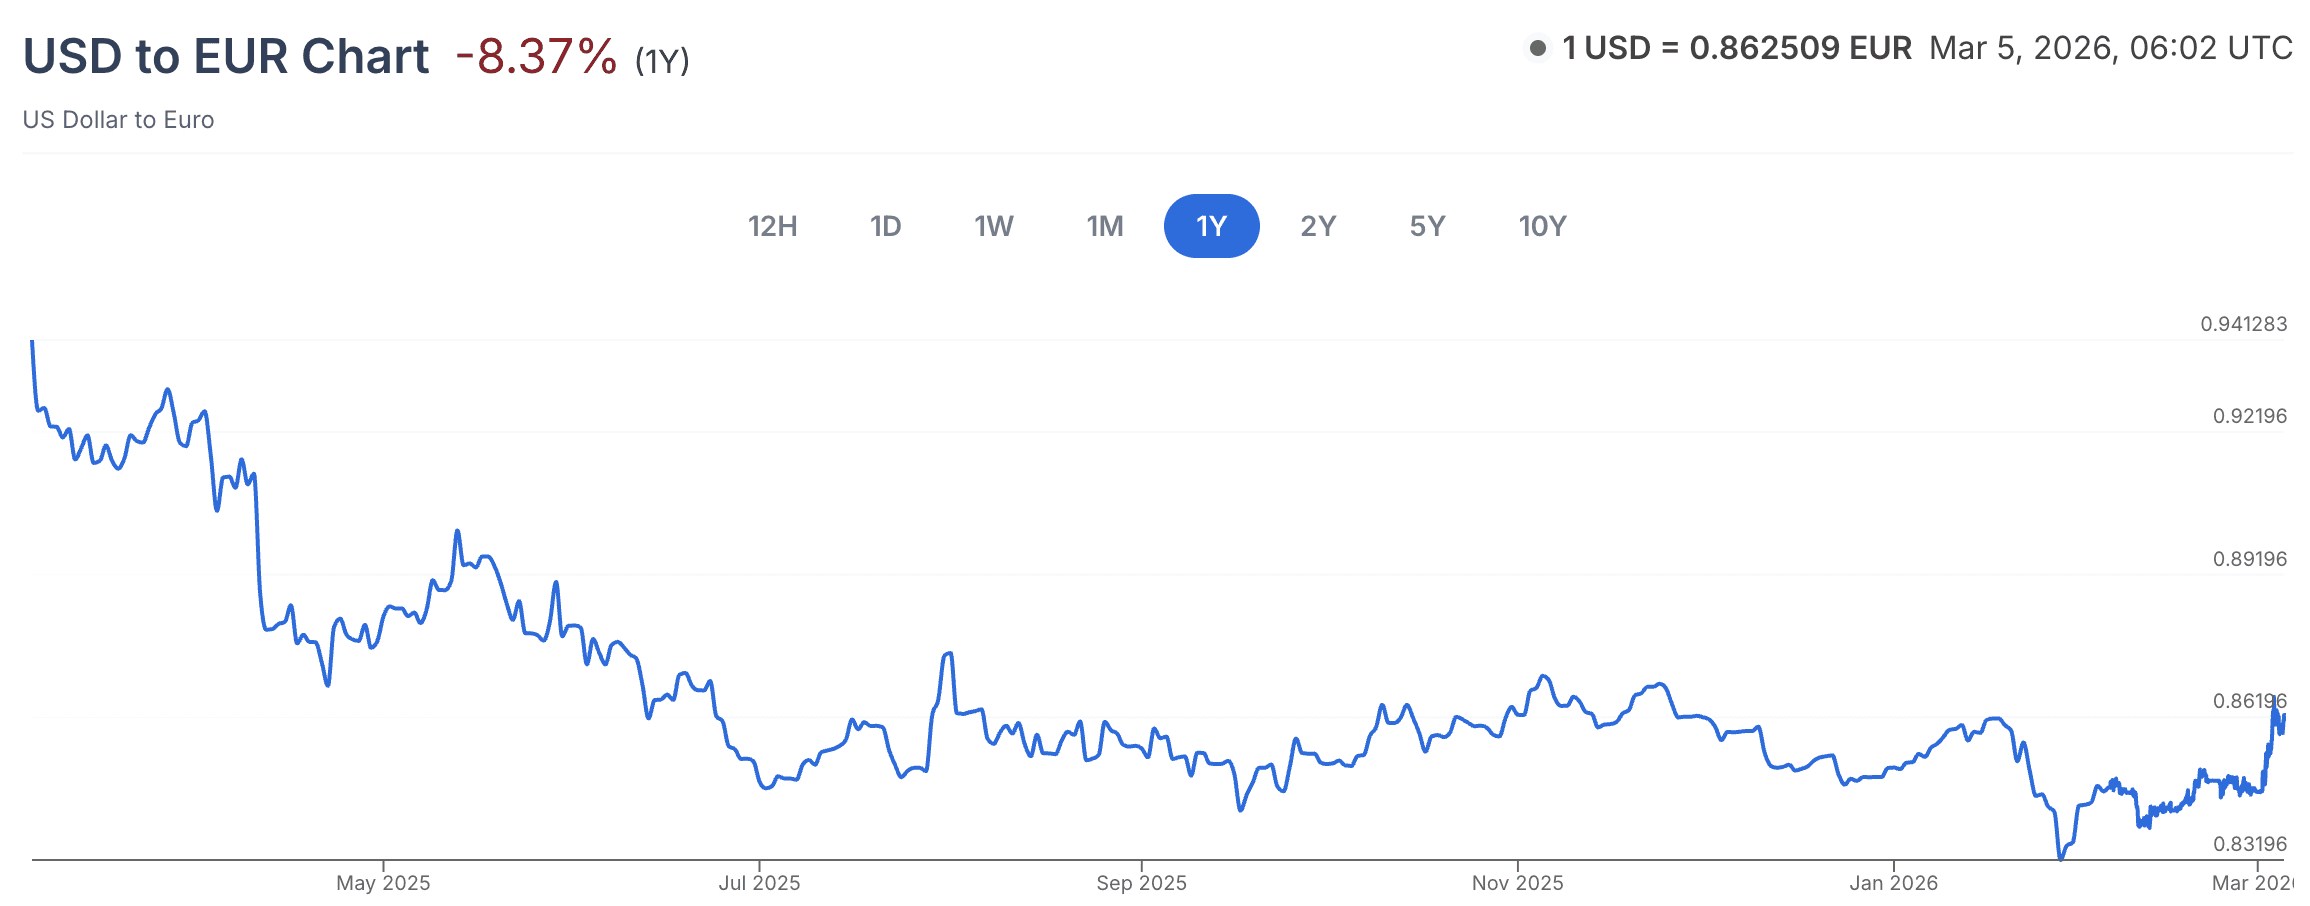
Exchange rate screenshot from XE.com [/caption]
The correct method is to convert financial data using the actual exchange rate at the time of the transaction—what's typically called time-of-event conversion.
This approach offers three concrete advantages:
It reflects business reality. Revenue from a sale in October 2022 and revenue from a sale in October 2024 happened in different exchange rate environments. Treating them as equivalent distorts your actual economics, especially for P&L analysis and strategic planning.
It creates a shared source of truth. Without a defined methodology, teams end up using different rates—finance uses one, sales uses another, the agency uses a third. Time-of-event conversion, sourced from a reliable provider, gives everyone a consistent foundation.
It enables flexible multi-currency reporting. Once your data is converted accurately, you can report your entire global Amazon business in any currency without recalculating from scratch.
How Reason Solves This
Currency conversion is built into BASIS, our analytics platform for Amazon vendors, from the ground up.
We pull daily exchange rates by currency pair directly from XE.com and apply time-of-event conversion to every financial data point we ingest: shipped revenue, COGS, co-op, chargebacks, deductions, and payments. When you switch currencies in a BASIS dashboard, you're not triggering a recalculation; the conversion is already done. The dashboards stay fast.
You can connect multiple Vendor Central accounts across any combination of countries and currencies and view them as a single consolidated business, or slice by marketplace, by account, or by any custom grouping. For brands managing pan-EU and UK businesses simultaneously, this is a meaningful capability.
The result is financial data that's accurate enough for everything from weekly business reviews to QBR prep to accounting reconciliation across every market you sell in.
Reason Automation builds financial data infrastructure and analytics for brands that wholesale to Amazon. Learn more