
Resources & Documentation
Comprehensive guides, documentation, and strategic resources to help you maximize your use of the Reason platform and your Amazon business performance.

Amazon Vendor Strategy
Strategic guides for vendor operations and growth

References by Category
Comprehensive help documentation by platform

Database Connection Guides
Connect your favorite BI tools to your data
User Manuals
Step-by-step guides for Reason tools

Data Dictionaries
Complete reference for all data fields
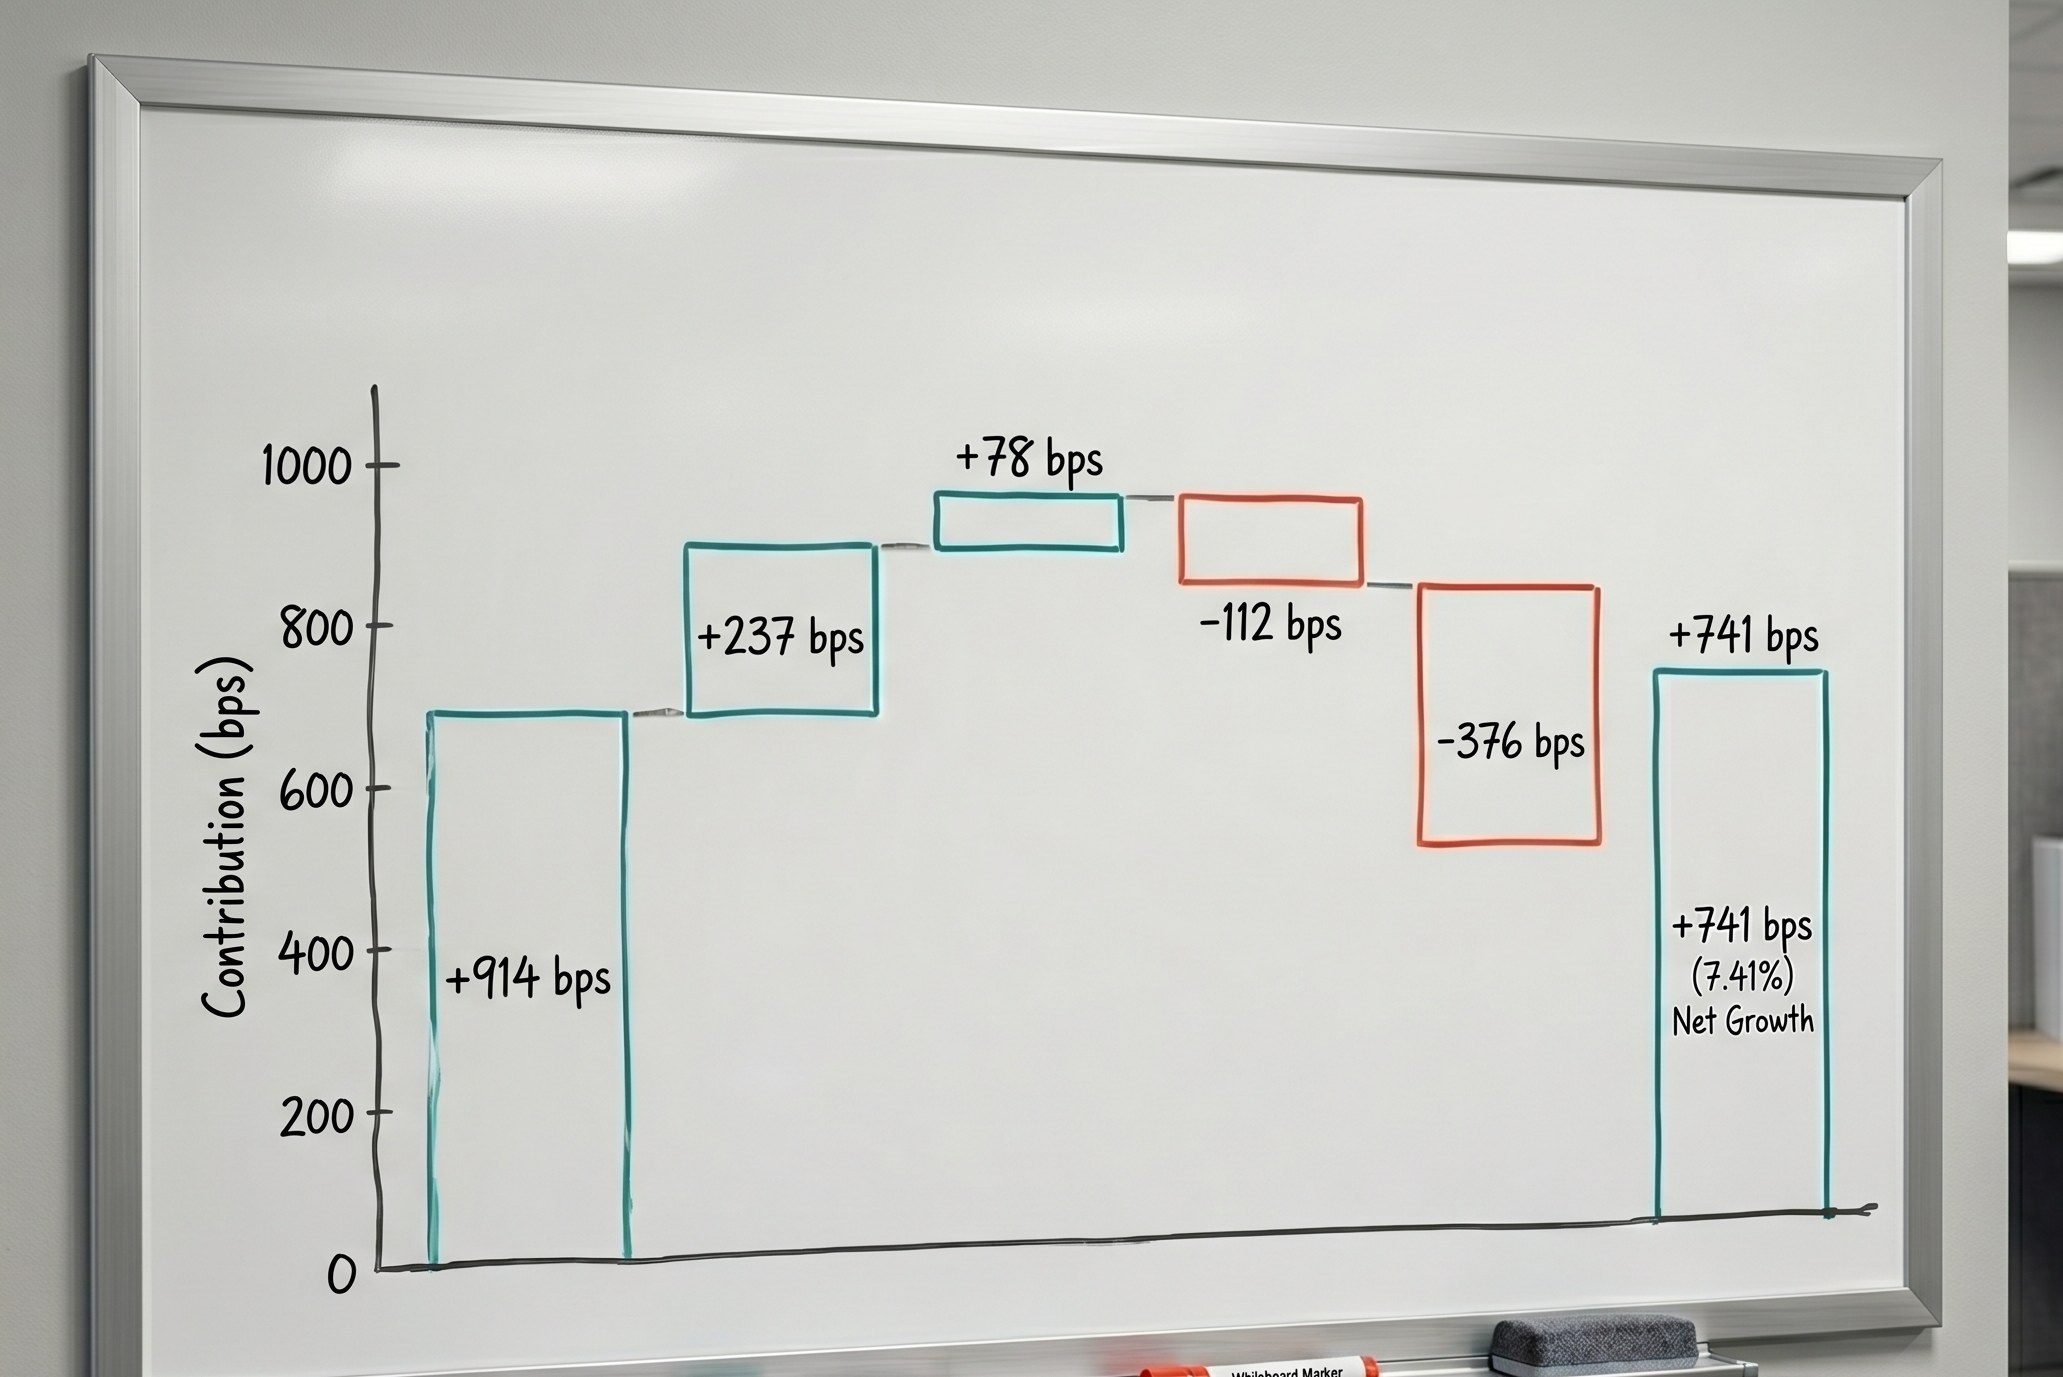
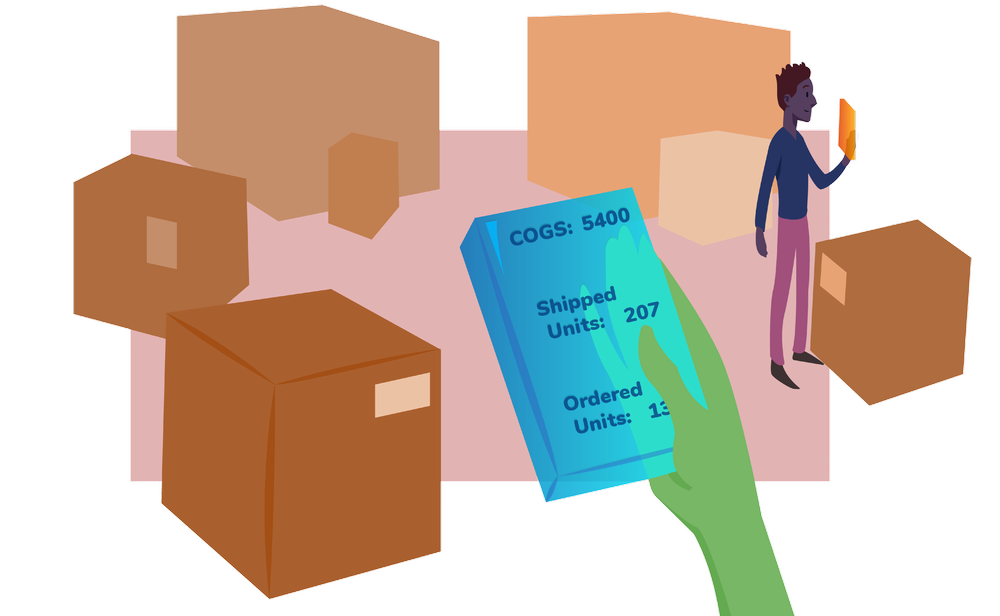
Contribution to Change (CTC): The Framework Behind Amazon's Business Reviews
Contribution to Change (CTC) is a framework that breaks down a total change in a metric (revenue, units, profit, margin) into the individual contributions of each product.
Amazon Provision for Receivables (PFR), Explained
This guide explains what PFR actually is, what drives it, and how to build it into your Amazon cash flow forecasting.

Your Agency Dashboard is Worthless.
Problem: every major consumer brand has already done the basic Amazon work. And it seems easier than ever to maintain that work with cheap tools and AI.
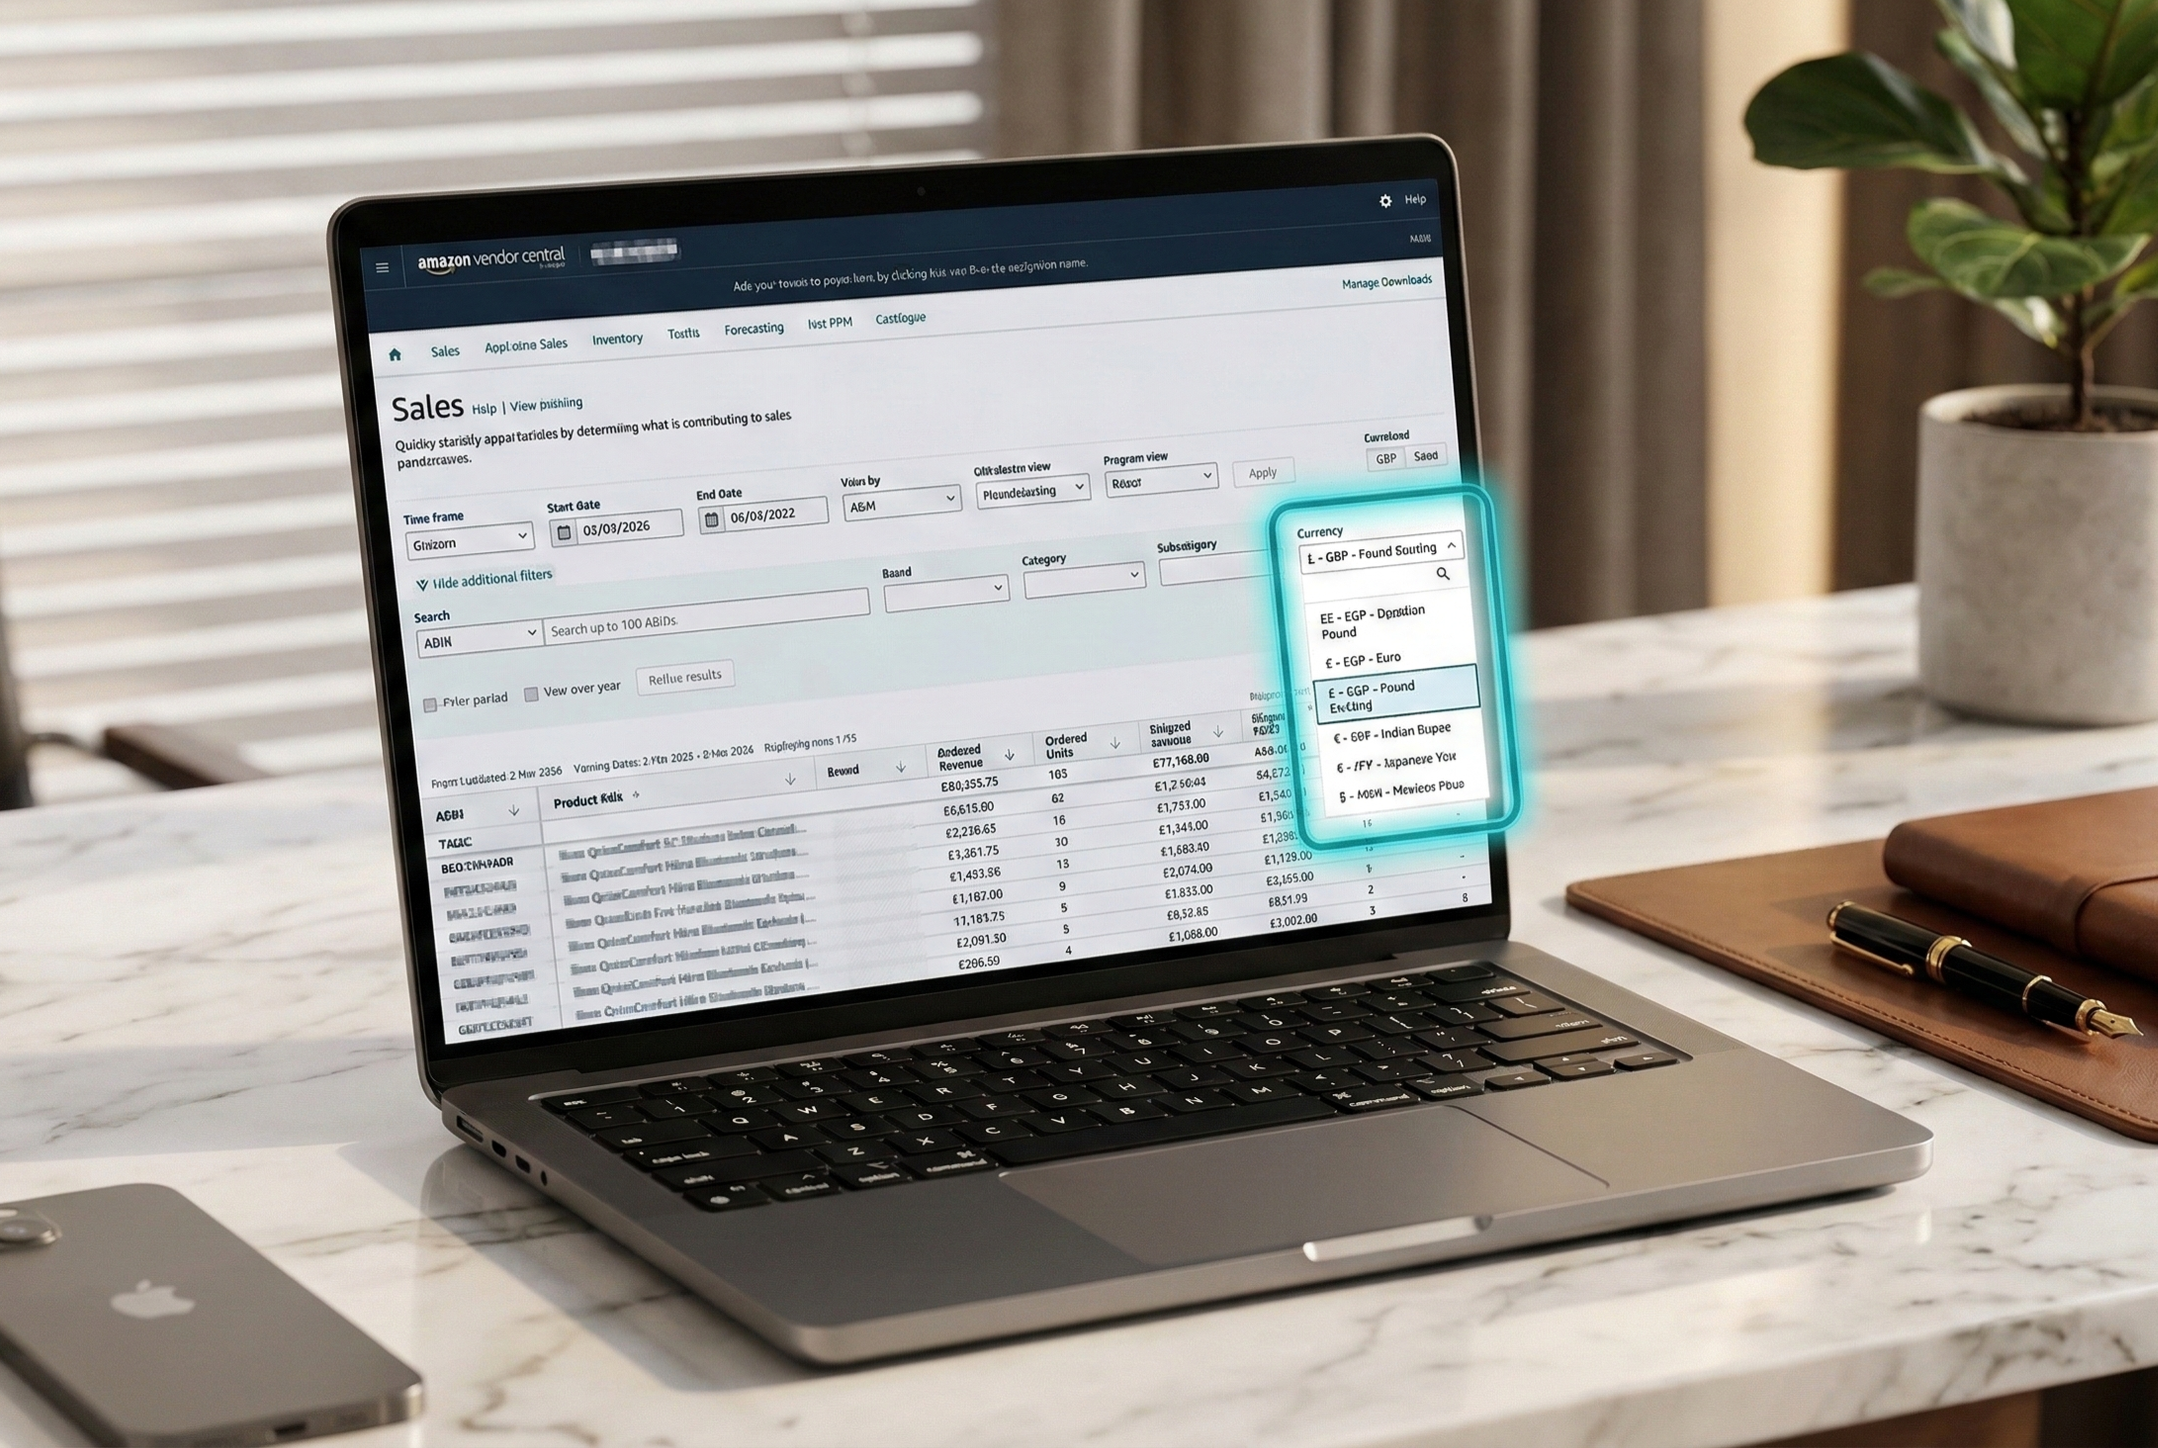
Amazon Vendor Central Currency Conversion: What's Wrong and How to Fix It
If you sell on Amazon across multiple countries, you already know that currency conversion is more than a cosmetic detail. Exchange rate shifts affect revenue, distort growth metrics, and can make the same business look different depending on the currency in which you‘re reporting.

The Net PPM Formula & Why Amazon Vendors Must Track This Metric
Vendors should think about Amazon’s profitability regularly — not just when QBR and AVN approach.

Amazon Demand Forecasting for Vendors
Amazon provides a consumer demand forecast for vendors in Retail Analytics. It’s the only leading indicator of what Amazon will buy from you, but most people dismiss it. Why?

Measuring Lost Buy Box and lost featured offer % as a 1P vendor
For ecommerce companies who sell through Amazon, the buy box is the difference between good and bad sales figures for a product. So here’s what you need to know about losing the buy box, and what you can do about it.

Amazon Glance Views and featured offer page views: About Vendor Central Traffic & Conversion Data
Your comprehensive guide to Amazon Vendor traffic data and analytics.

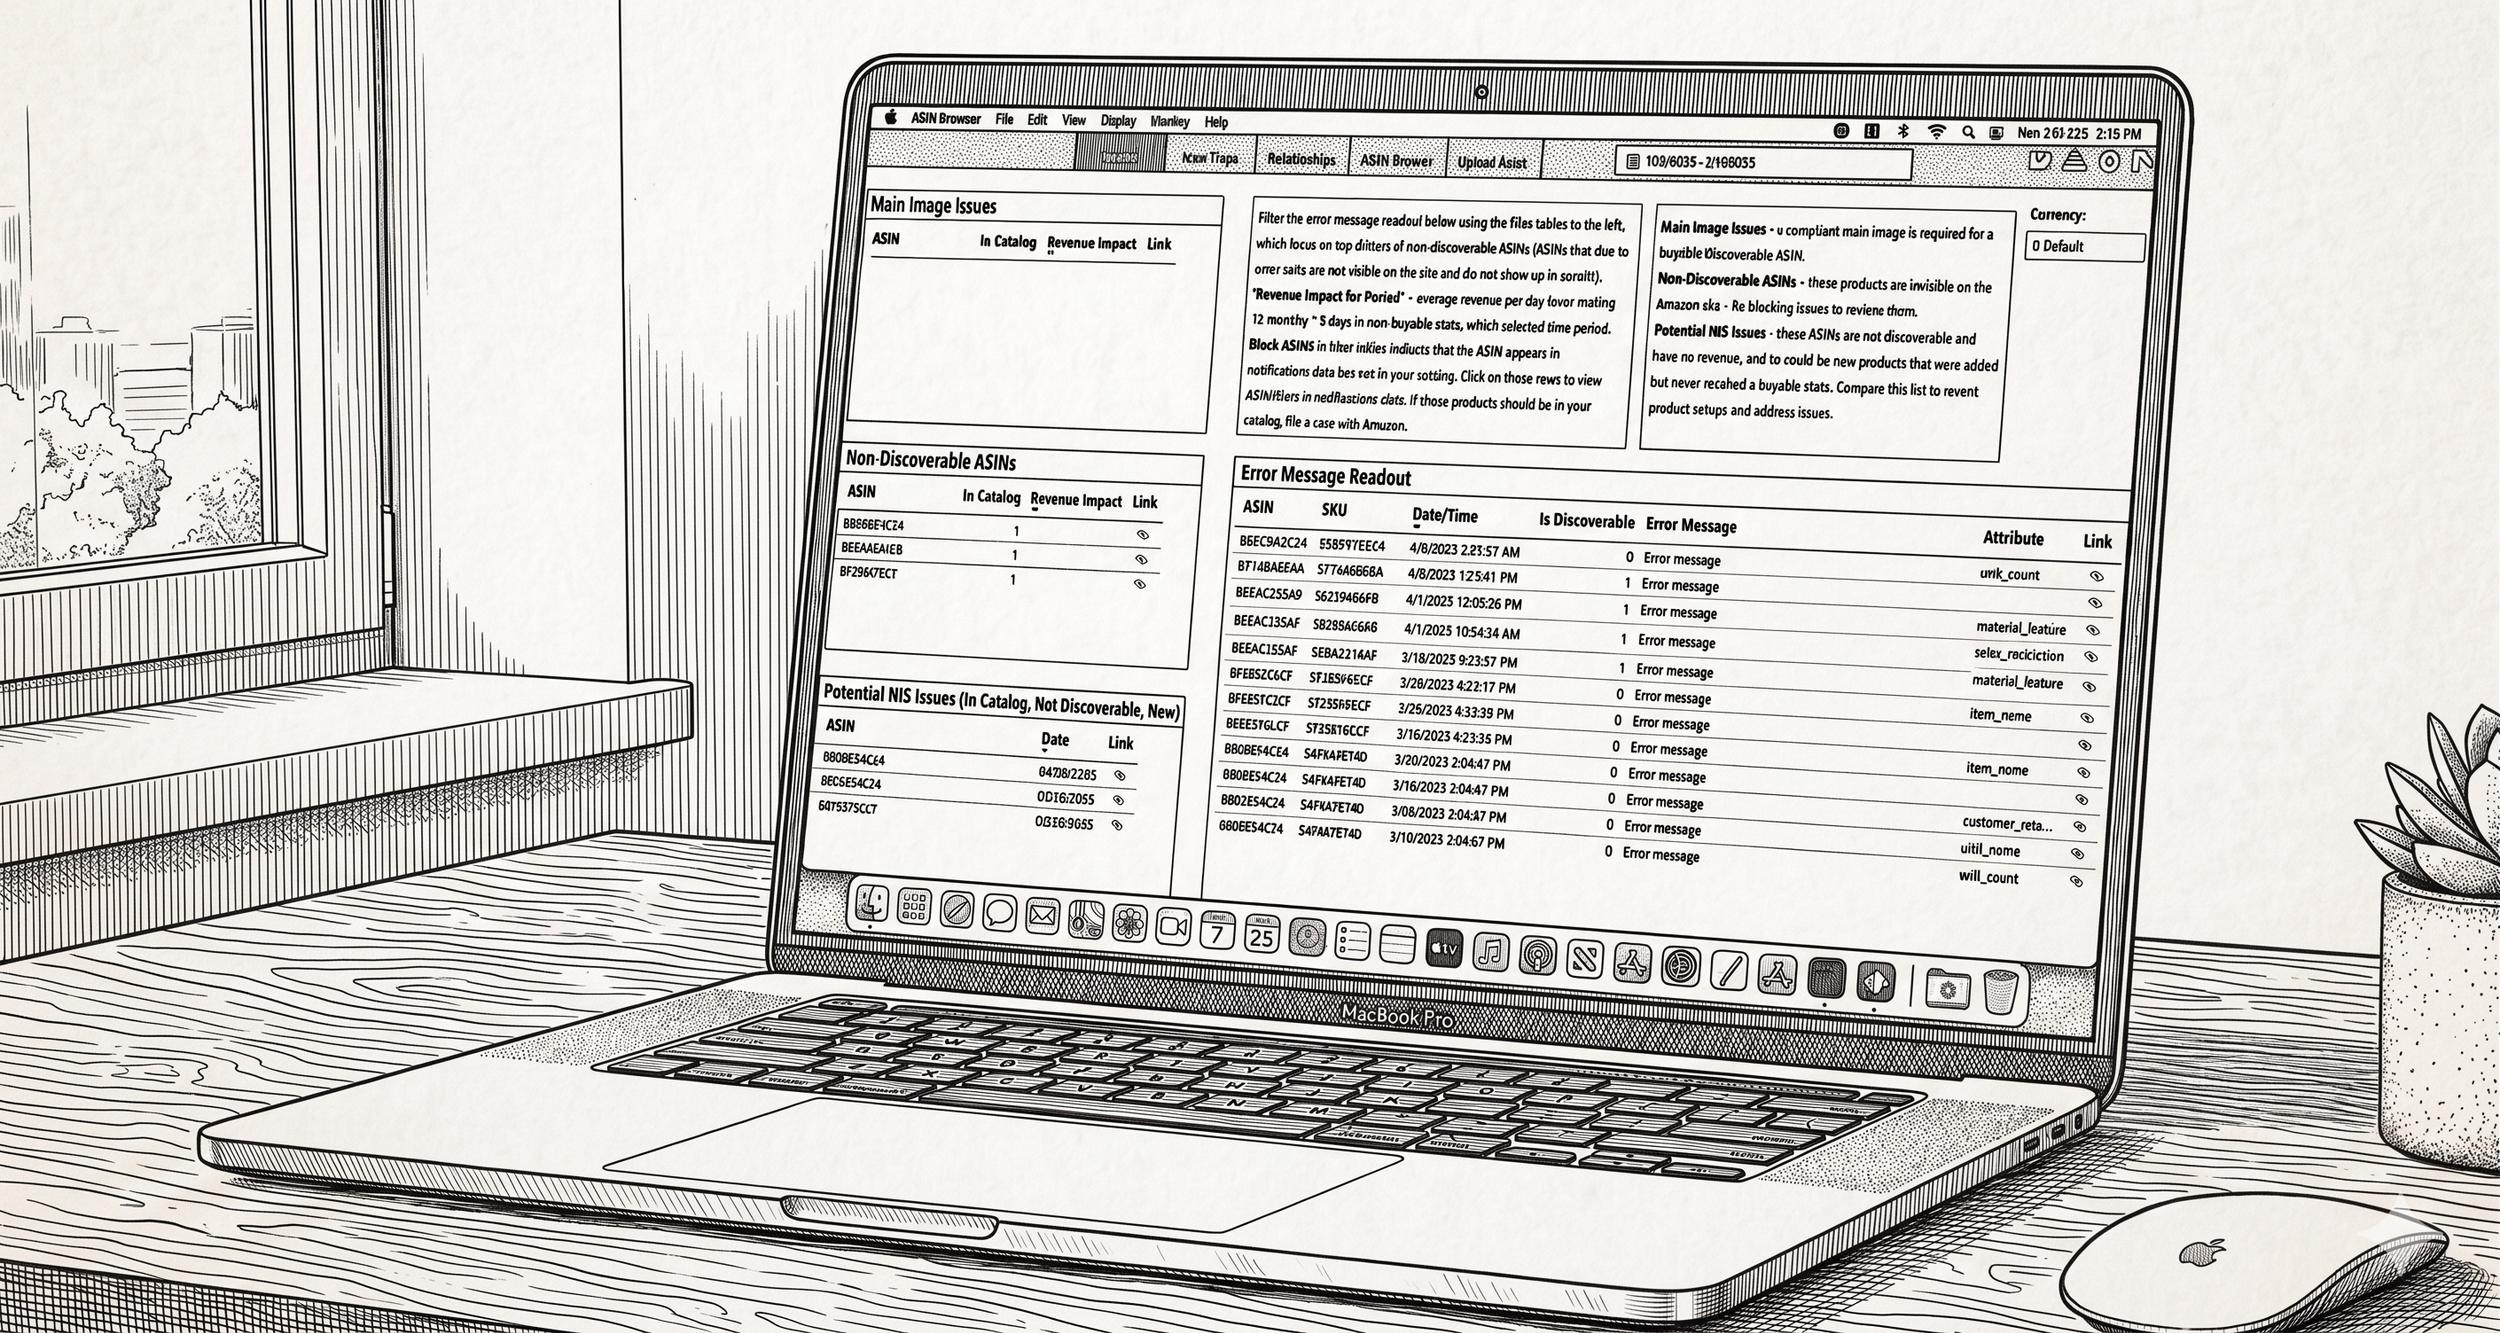
How to Understand and Use Amazon Vendor Central Reports
Understanding Amazon Vendor datasets and performing specific analyses is crucial for vendors to optimize operations, improve customer satisfaction, and drive success on the platform.

Top 5 Free Amazon Seller Analytics Tools
Being an Amazon seller means constantly crunching numbers. But dealing with data can be expensive, so you’re always looking for some free tools that can make your life a little easier.

Why Our Customers Own Their Data
Everyone loves useful insights and benchmarks. They give us ideas, help us understand whether we're performing better or worse than average. But insights aren't free—they cost the privacy of everyone who contributed data, even anonymous data.

Why We Started Reason Automation
When pulling data takes time, you do it less often—and anyone managing an Amazon business knows that speed and frequency matter. If ad performance fluctuates daily, can you afford to look at your business data weekly or monthly?